Analysis & Forecast
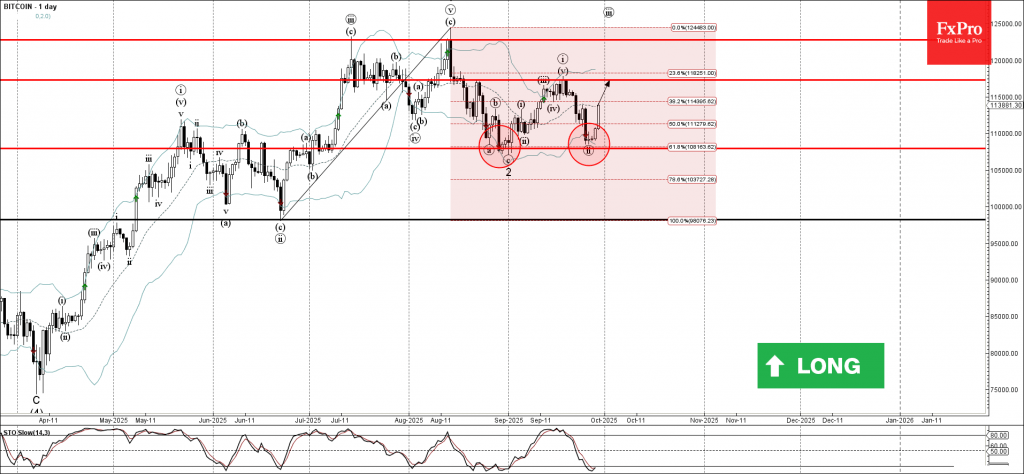
Bitcoin: ⬆️ Buy– Bitcoin reversed from support area– Likely to rise to resistance level 117325.00Bitcoin cryptocurrency recently reversed from the support area between the pivotal support level 108000.00 (which stopped two previous co...
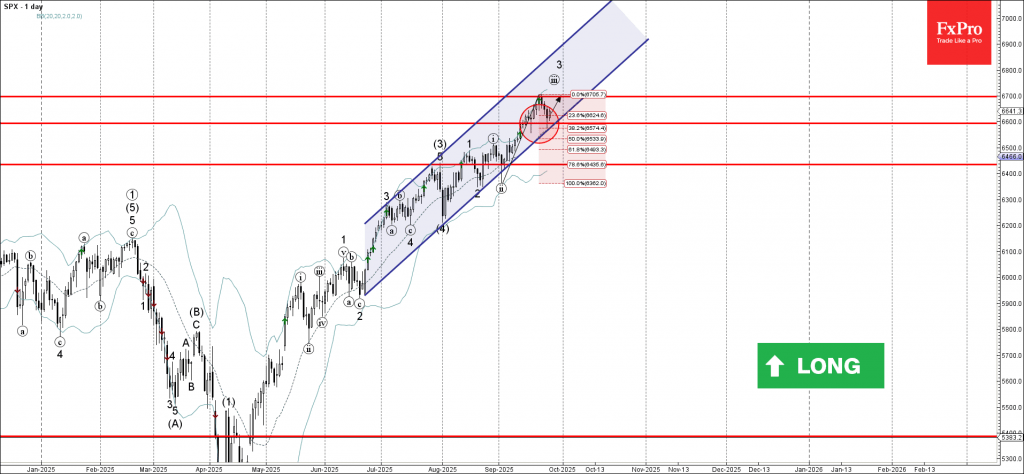
S&P 500: ⬆️ Buy– &P 500 index reversed from support level 6600.00– Likely to rise to resistance level 6700.00S&P 500 index recently reversed up from the key support level 6600.00 (which also reversed the index in the middl...
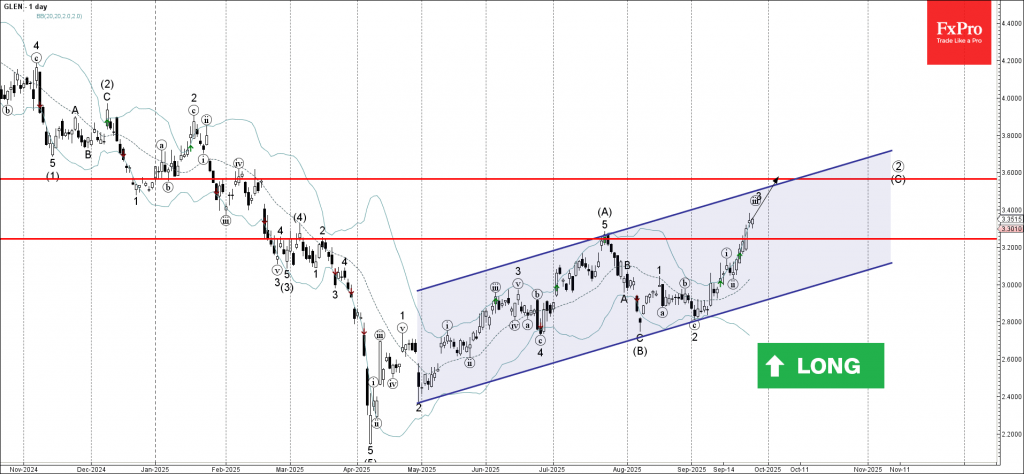
Glencore: ⬆️ Buy– Glencore broke key resistance level 3.2525– Likely to rise to resistance level 3.600Glencore recently broke above the key resistance level 3.2525 (which stopped wave (A) at the end of July, as can be seen from the da...
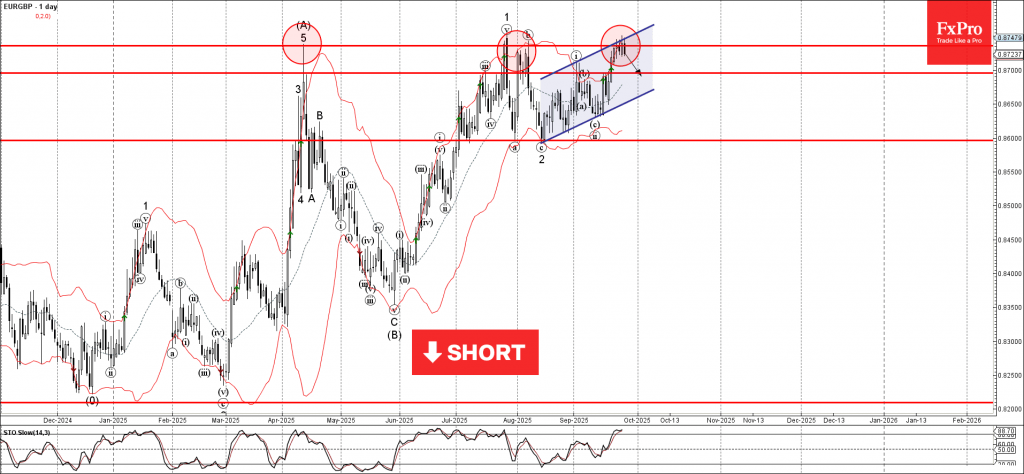
EURGBP: ⬇️ Sell– EURGBP reversed from long-term resistance level 0.8735– Likely to fall to support level 0.8700EURGBP currency pair recently reversed from the resistance area between the major long-term resistance level 0.8735 (former...
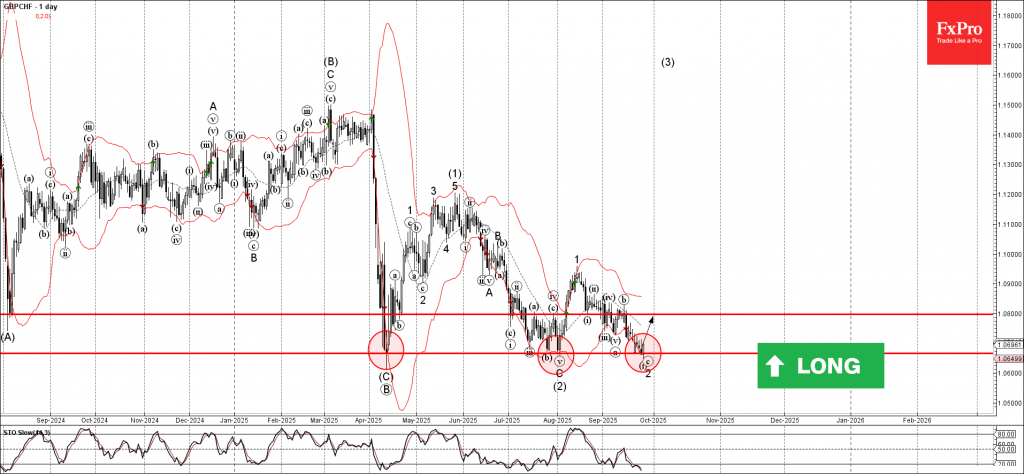
GBPCHF: ⬆️ Buy– GBPCHF reversed from support area– Likely to rise to resistance level 1.0800GBPCHF currency pair recently reversed up from the support area between the strong support level 1.0665 (which has been reversing the price fr...
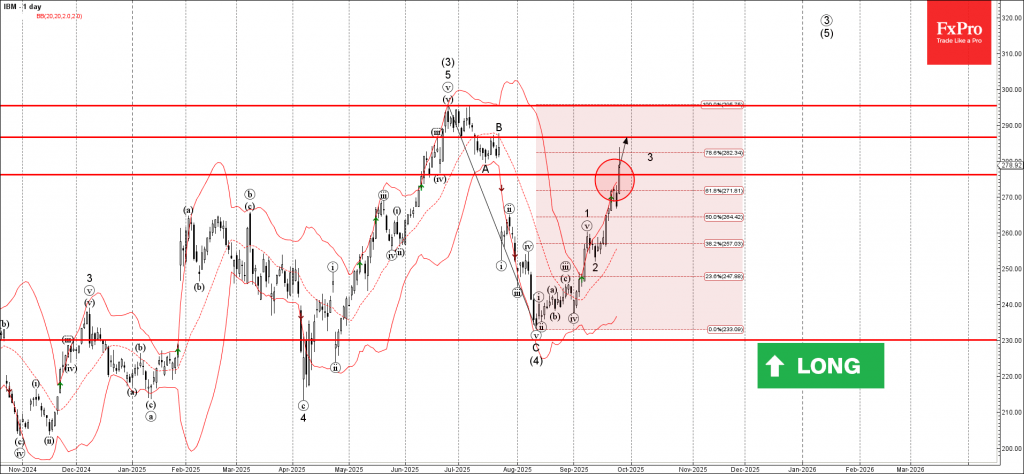
IBM: ⬆️ Buy– IBM broke resistance area– Likely to rise to resistance level 286.75IBM recently broke the resistance area between the resistance level 276.00 and the 61.8% Fibonacci correction of the ABC correction (4) from June.The bre...
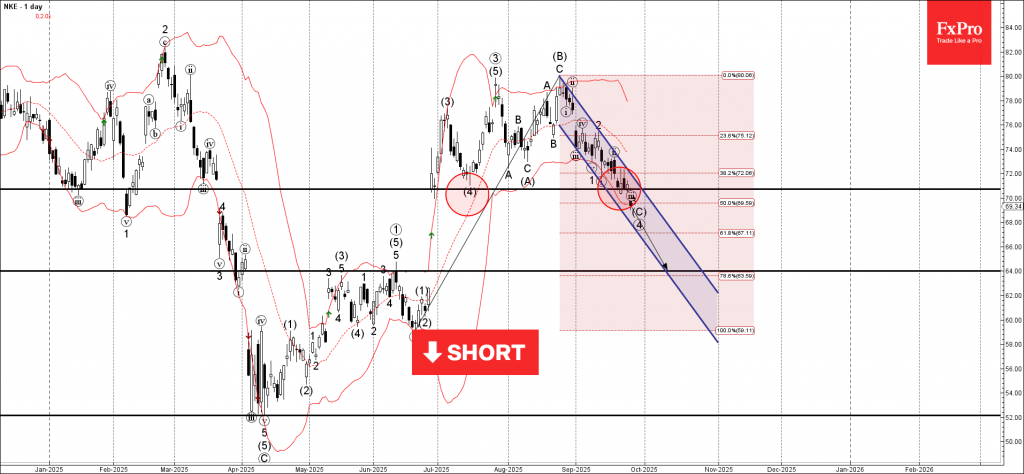
Nike: ⬇️ Sell– Nike recently broke support area– Likely to fall to support level 64.00Nike recently broke the support area between the key support level 70.70 (which stopped the previous correction (4) in July) and the 50% Fibonacci c...
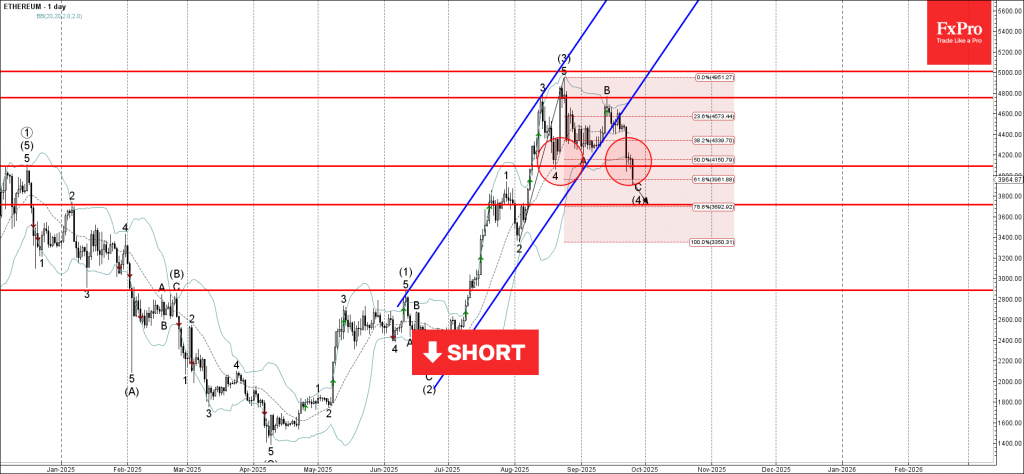
Ethereum: ⬇️ Sell– Ethereum broke support area– Likely to fall to support level 3714.00Ethereum cryptocurrency recently broke the support area between the key support level 4090.00 (which stopped the previous corrections 4 and A) and ...
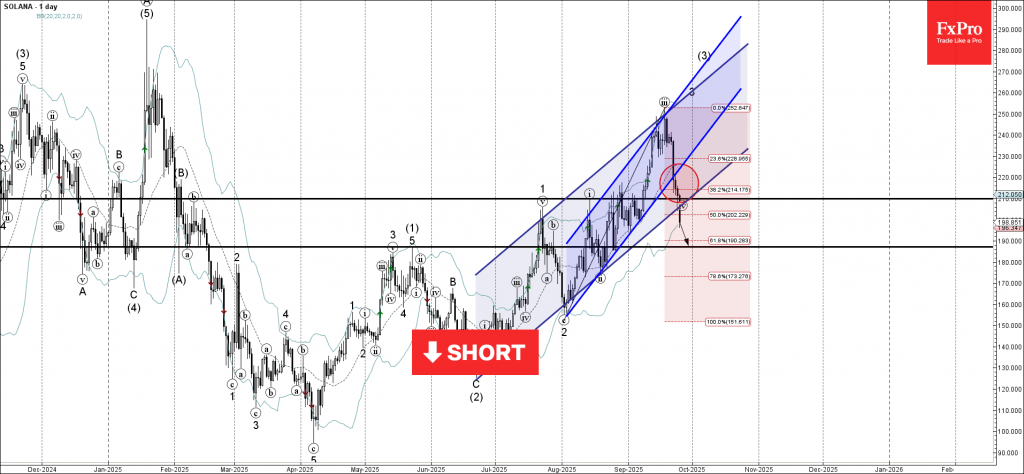
Solana: ⬇️ Sell– Solana broke support area– Likely to fall to support level 187.20Solana cryptocurrency recently broke the support area between the key support level 210.00 (former resistance from August), support trendlines of the 2 ...
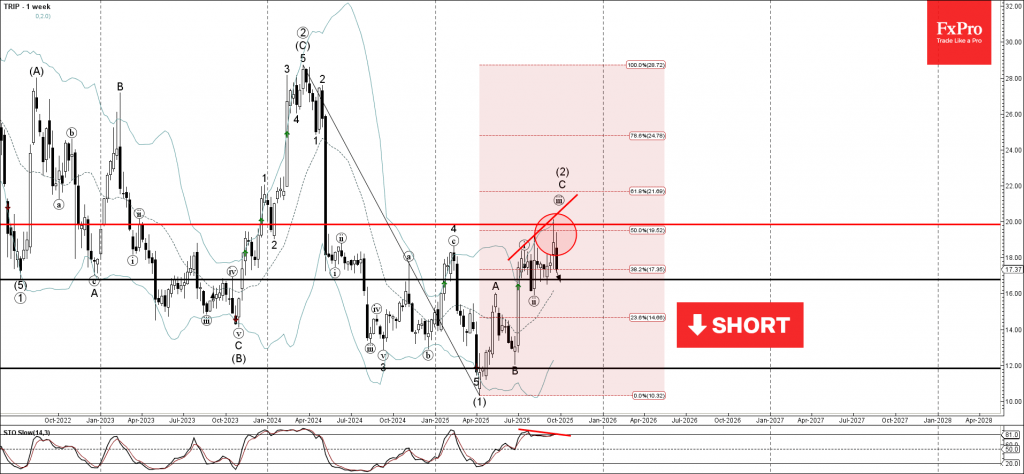
Trip: ⬇️ Sell– Trip reversed from resistance area– Likely to fall to support level 16.80Trip recently reversed down from the resistance area between the round resistance level 20.00, upper daily Bollinger Band and the 50% Fibonacci co...
