
Johnson & Johnson: ⬇️ Sell
– Johnson & Johnson reversed from the resistance zone
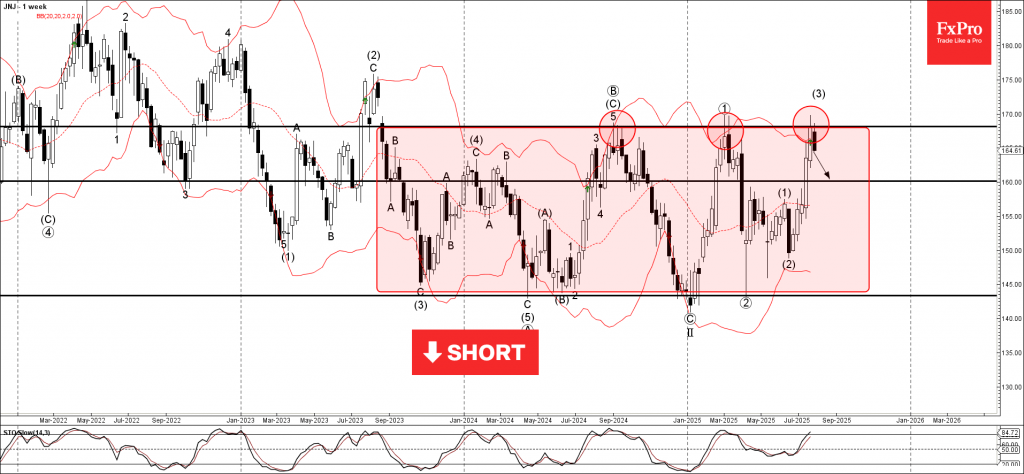
– Likely to fall to support level 160.00
Johnson & Johnson recently reversed down from the strong resistance zone located between the long-term resistance level 168.15 (upper border of the weekly sideways price range from 2023) and the upper weekly Bollinger Band.
The downward reversal from this resistance zone stopped the earlier intermediate impulse wave (3).

Given the strength of the resistance level 168.15 and the overbought weekly Stochastic, Johnson & Johnson can be expected to fall to the next support level 160.00.
Source: https://fxpro.news