
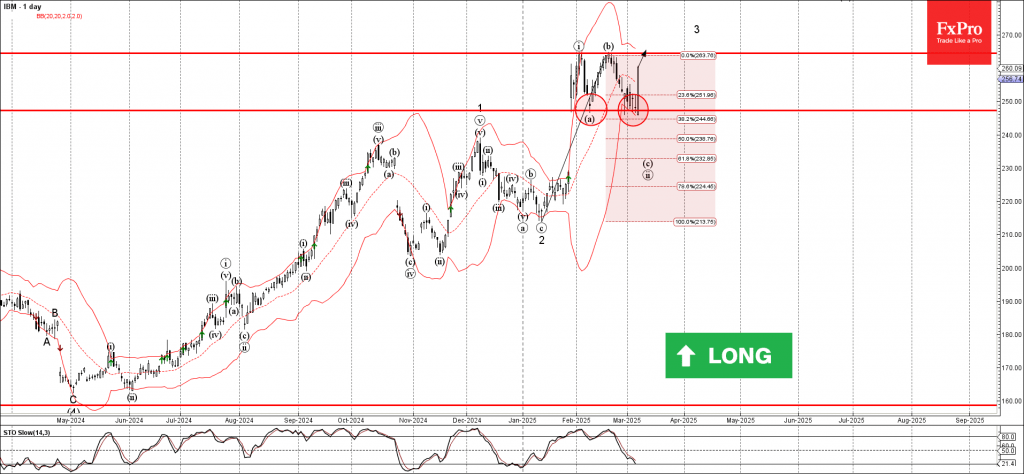
IBM: ⬆️ Buy
– IBM reversed from the support zone
– Likely to rise to the resistance level 264.40
IBM recently reversed from the support area between the support level 247.25 (which stopped the previous minor correction a), lower daily Bollinger Band and the 38.2% Fibonacci correction of the upward impulse from January.
The upward reversal from this support zone continues the active upward impulse wave 3 of the extended upward impulse sequence (5) from last year.

Given the clear daily uptrend, IBM can be expected to rise further to the next resistance level 264.40 (top of the previous waves i and b).
Source: https://fxpro.news