
Bank of America: ⬇️ Sell
– Bank of America reversed from resistance zone
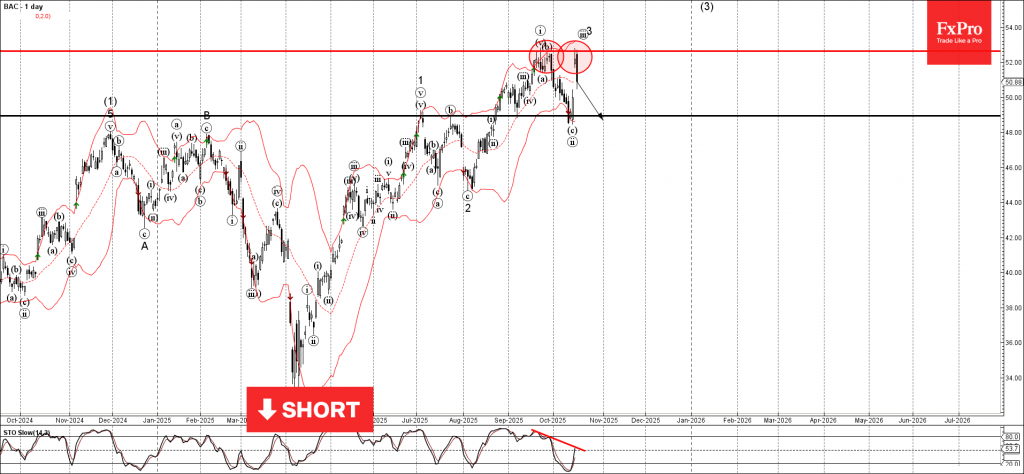
– Likely to fall to support level 49.00
Bank of America recently reversed from the resistance area between the key resistance level 52.65 (which stopped the sharp uptrend in September) and the upper daily Bollinger Band.
The downward reversal from resistance zone created the daily Japanese candlesticks reversal pattern Bearish Engulfing.

Given the strength of the resistance level 52.65 and the bearish divergence on the daily Stochastic, Bank of America can be expected to fall to the next strong support level 49.00 (former double top from July).
Source: https://fxpro.news