Manufacturing Output ekes out small gain even as the output of motor vehicles & parts fell
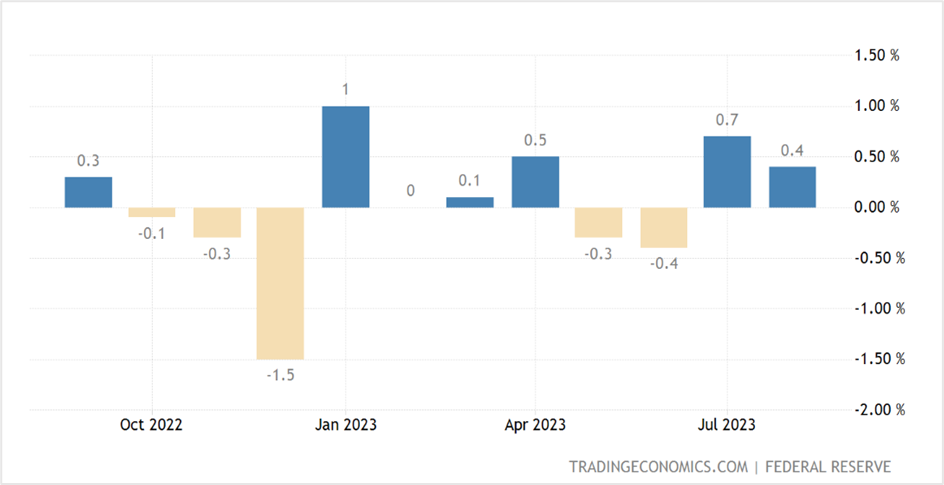
Production at US factories rose by 0.4% in August, a sharp decline from the 0.7% increase the previous month, the Federal Reserve reported on Friday. On the other hand, capacity utilization improved to 79.7% in August from 79.5% in July but is down 0.3 percentage points from its long-term (1972-2022) average.
Meanwhile, the manufacturing output edged 0.1% higher in August, following a downwardly revised 0.4% gain in July. The sharp drop was attributed to a 5% fall in motor vehicles and parts output. Excluding automobiles, output climbed 0.6% after being unchanged in July, but production was down 0.6% compared to last year.
Manufacturing, which accounts for more than 11% of the US economy, is under pressure from slowing consumer demand for goods and services due to the surge in interest rates and a weak global outlook. Despite this, there were signs that factory output was beginning to stabilize, but the strikes by the United Auto Workers (UAW) Union at three factories owned by Ford, General Motors, and Chrysler parent Stellantis could impact September’s manufacturing activity somewhat.
Earlier this month, the Institute for Supply Management’s (ISM) gauge of national factory activity contracted for the tenth consecutive month. However, the pace of the decline slowed.
Based on a survey of economists by the Wall Street Journal, the overall data was better than expected. The prediction was for industrial production to rise by a tiny 0.2% in August and capacity utilization to come in at 79.3%.
US Industrial Production- month-on-month figures

Key highlights of the industrial production data
The output drop in motor vehicles and parts drove the consumer durables and transit equipment indexes lower, but most other major market groups rose in August. The index measuring consumer nondurables rose 0.4%, the index for materials gained 0.7%, and within materials, energy materials surged 1.5%, while non-energy materials edged up 0.1%. Meanwhile, the output of defense and space equipment jumped 3.5% in August and is up over 10% year-on-year.
Among the industry groups, the index for durable manufacturing rose by a tiny 0.1% in August, and the index for nondurable manufacturing was up 0.2%.
The gains in durable manufacturing came from primary metals (1.6 percent), machinery (2.0 percent), aerospace and miscellaneous transportation equipment (3.3 percent), and furniture and related products (1.3 percent). In the nondurable manufacturing group, gains of 1% or more were seen in the printing support and chemicals indexes.
The other significant contributor was mining output, which climbed 1.4% in August, primarily due to oil and gas extraction, while utilities output rose 0.9%.
Economist view on the factory output news
Rubeela Farooqui, the chief US economist at High-Frequency Economics, believes the industrial sector faces headwinds from high borrowing costs and low demand for goods. She thinks demand could stabilize at lower levels, and with onshore and infrastructure spending, manufacturing activity would improve in the coming months.
Market reaction to the industrial production news
US equities fell across the board on Friday, with all the major stock indices ending in the red as investors continued to book profits ahead of the Federal Open Market Committee (FOMC) meeting this week. The S&P 500 fell 1.22% to close at 4450.32, the Dow Jones Industrial Average dropped 0.83% to 34618.24, while the Nasdaq 100 slid 1.75% to settle at 15202.40 on Friday. Except for the Dow, which eked out small weekly gains, the S&P 500 and the Nasdaq 100 finished the second consecutive week in the negative. The three indices are approaching crucial near-term supports, and the outcome of the Fed meeting will determine if they rebound from the levels or plummet further.
In the currency markets, the greenback closed slightly lower against its counterparts in the US dollar index (DXY), pulling back from more than six-month highs, but still managed to end the ninth consecutive week in the positive. Among individual currencies, the euro reversed two straight sessions of losses, gaining 0.16% on Friday, but the single currency was down 0.36% for the week. The drop in the euro comes despite the ECB raising interest rates by 25 basis points last Thursday to push the benchmark deposit rate to 3.75%-4.00%, the highest since the euro was launched in 1999. On the other hand, the pound sterling fell for the second consecutive session, while the Japanese yen registered the fourth successive day of losses against the US currency.
In the US Treasury markets, yields rose on Friday, notching the second weekly gains to advance to the highest in September amid concerns of price pressure in the automobile sector from the UAW strike. The yield on the rate-sensitive 2-year Note climbed 1.9 basis points to end the week at 5.03%, while the yields on the benchmark 10-year and 30-year Treasury surged 3.2 and 2.6 basis points to 4.321% and 4.410%, respectively.
Yields are rising despite markets expecting the Federal Reserve to pause interest rate hikes this week. However, some analysts anticipate policymakers to remain hawkish and prepare markets for the upcoming rate hikes later this year. Others forecast interest rates to remain elevated, with no significant rate cuts next year.
Technical View
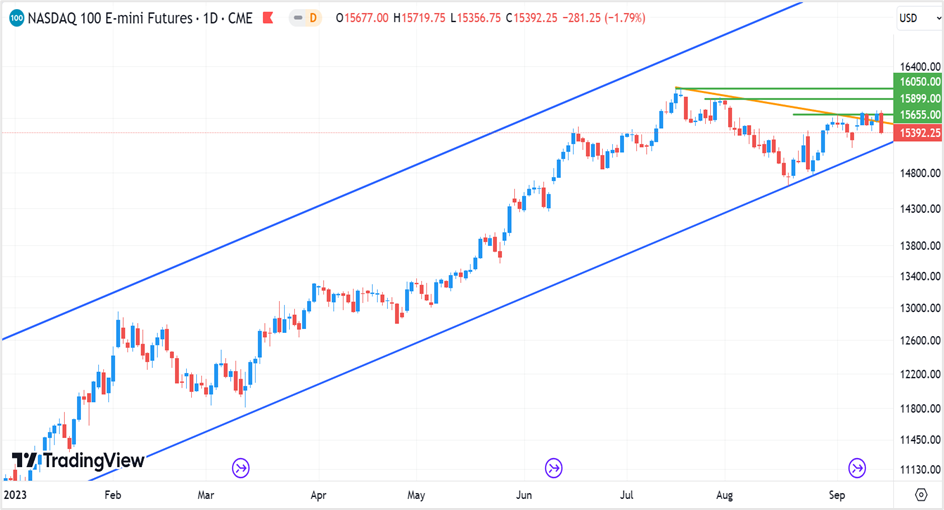
Nasdaq December futures settled at 15392.25 on Friday, down 1.79% on the day and 0.66% for the week. The tech-heavy index reversed gains after testing the 1st September highs of 15661 (horizontal green line) and is likely to oscillate between near-term support at 15250 (highlighted by the blue trendline) and near-term resistances at 15650, at least until markets digest Fed Chair Jerome Powell’s speech following the FOMC meeting on Wednesday. A break below the support will signal further bearishness, with the index futures likely to target 14450-14500 very quickly. On the upside, a close above the 19th July highs of 16060 will drive the current uptrend further.
The strategy for the week will be to go long on Nasdaq futures at 15250 with a stop at 15200 for a short-term target of 15600. However, if prices break 15200, reverse long positions with a stop loss at 15350 and exit as the index approaches 14550-600.
Nasdaq December futures- Daily chart

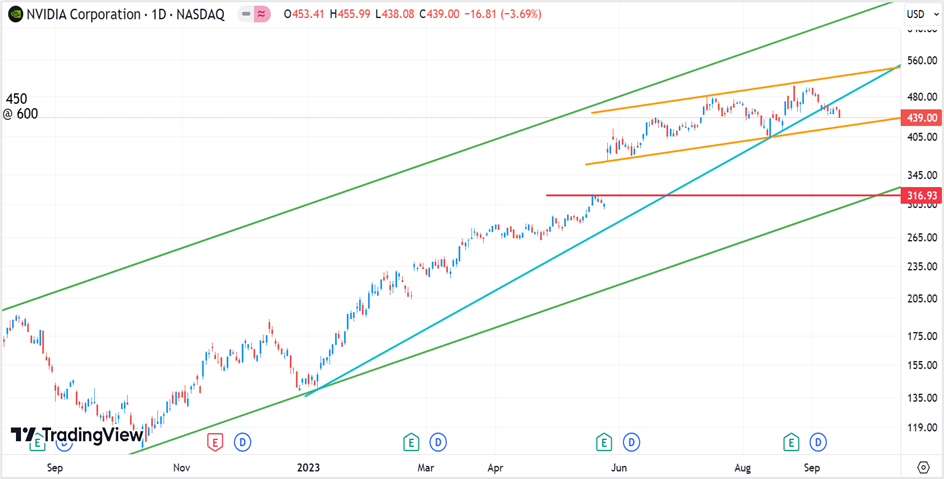
Shares of Nvidia Corporation fell 3.69% on Friday to end the session at $439.00, the lowest settlement since 17th August. Prices have been in a correction phase since the stock broke and closed below major support at $460.00, with the decline likely to extend toward the next support at around $425.00. If prices hold above this support for the week, the current uptrend could drive the chip giant toward new all-time highs. But a close below will push Nvidia shares toward the 14th August lows of $403, with the bearish move likely to extend further toward $310- 320 (the upward-sloping green trendline and the red horizontal line).
Go long on Nvidia at $420-425, with a stop loss at $410 and exit at $480-490. However, if prices close below the support at $425 or break $410, reverse your long positions with a stop loss at $435 for a target of $325-330.
NVidia- Daily chart


 United KingdomUS