Analysis & Forecast
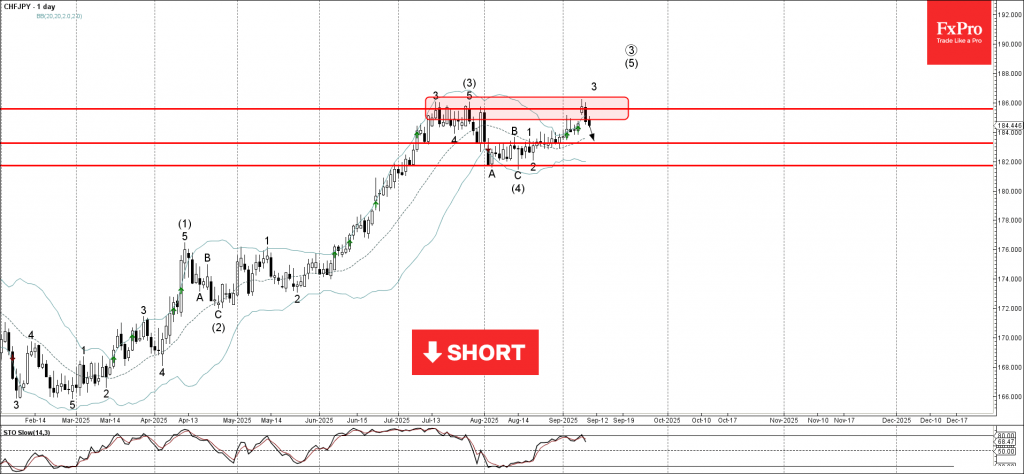
CHFJPY: ⬇️ Sell– CHFJPY reversed from resistance area– Likely to fall to support level 183.20.CHFJPY currency pair recently reversed down from the resistance area between the key resistance level 186.00 (which has been reversing the p...
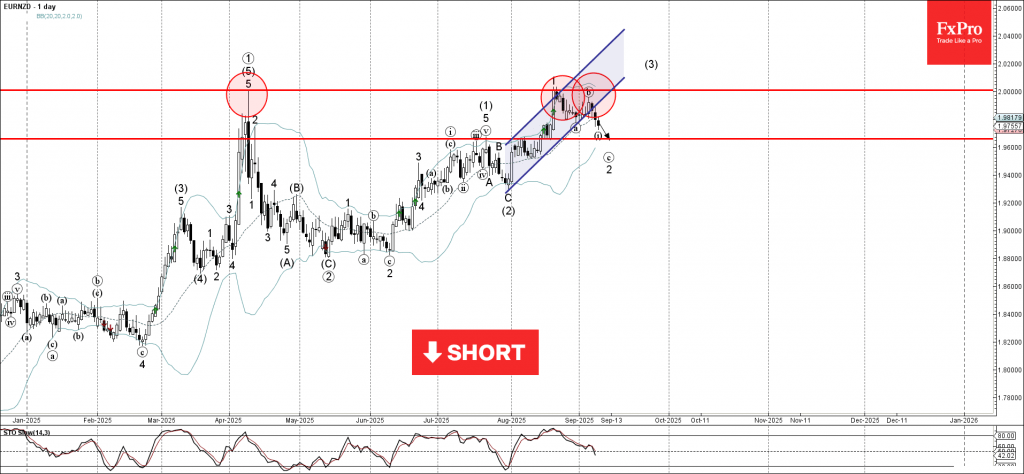
EURNZD: ⬇️ Sell– EURNZD broke daily up channel– Likely to fall to support level 1.9660EURNZD currency pair recently reversed down from the resistance area between the round resistance level 2.0000 (former powerful resistance from Apri...
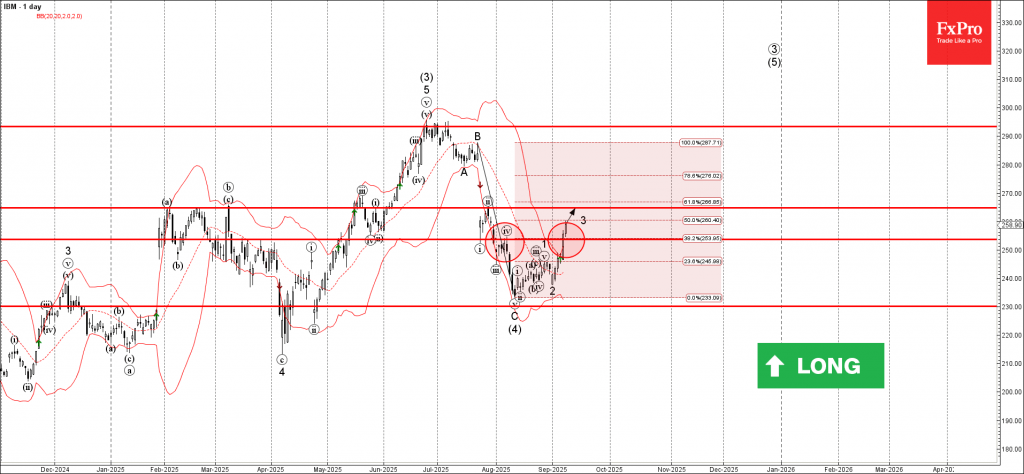
IBM: ⬆️ Buy– IBM broke resistance area– Likely to rise to resistance level 265.00IBM recently broke resistance area between the resistance level 253.60 (which has been reversing the price from the start of August) and the 38.2% Fibona...
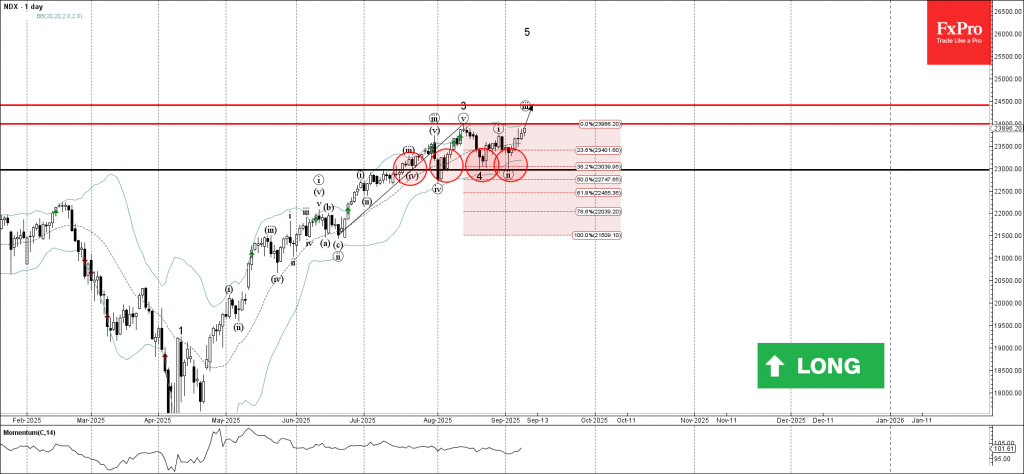
Nasdaq-100: ⬆️ Buy– Nasdaq-100 reversed from the support area– Likely to rise to resistance level 24500.00Nasdaq-100 index recently reversed up from the support area between the pivotal support level 23000.00 (which has been reversing...
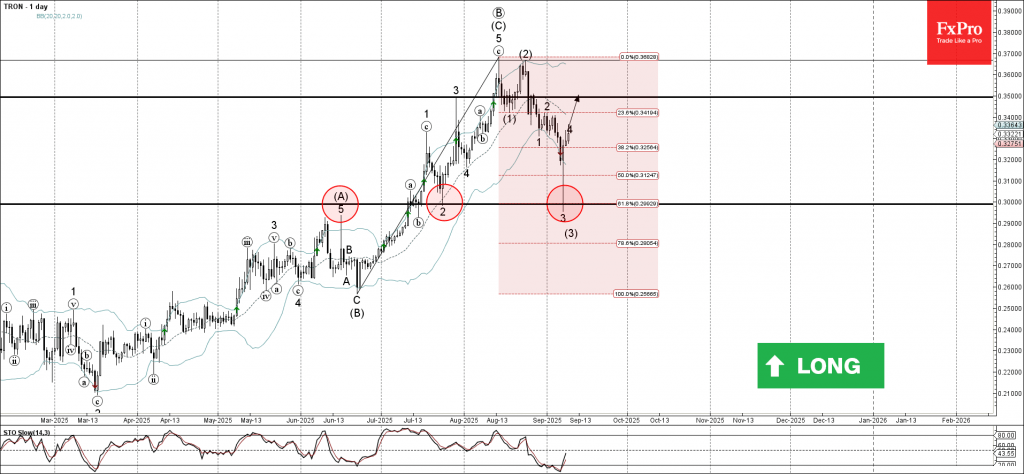
TRON: ⬆️ Buy– TRON reversed from the round support level 0.3000– Likely to rise to resistance level 0.3500TRON cryptocurrency recently reversed up from the strong support zone between the round support level 0.3000 (which has been rev...
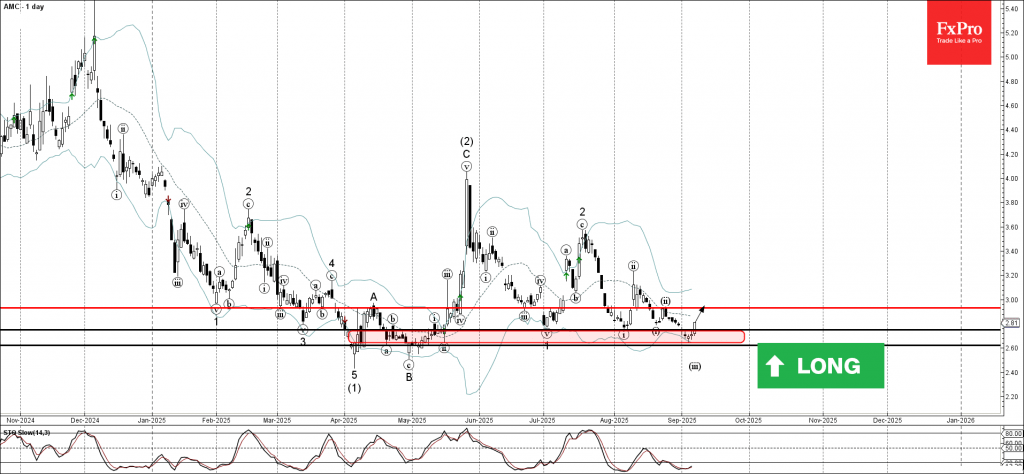
AMC: ⬆️ Buy– AMC reversed from support zone– Likely to rise to resistance level 2.90AMC recently reversed up from the strong support zone between the support levels 2.75 and 2.60 (which has been reversing the price from the start of A...
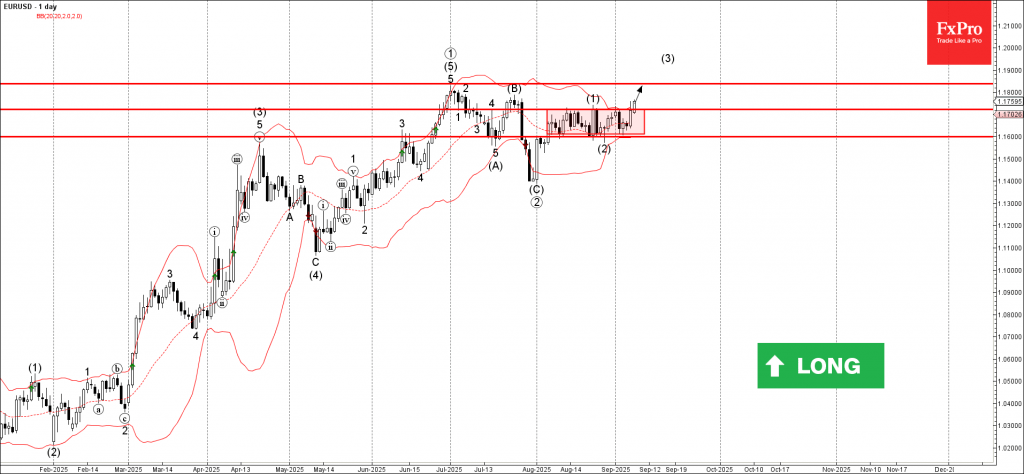
EURUSD: ⬆️ Buy– EURUSD broke resistance level 1.1720– Likely to rise to resistance level 1.1835EURUSD currency pair recently broke the resistance level 1.1720 (which is the upper border of the narrow sideways price range inside which ...
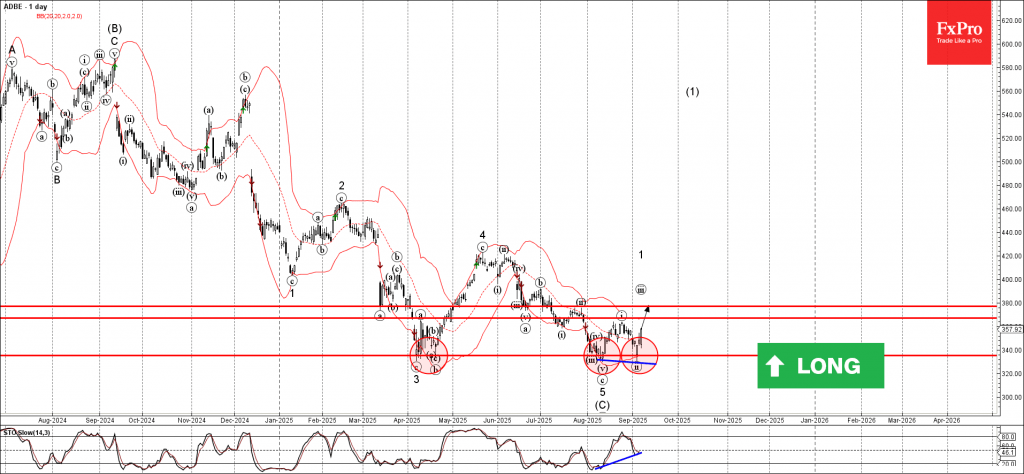
Adobe: ⬆️ Buy– Adobe reversed from support zone– Likely to rise to resistance level 380.00Adobe recently reversed up from the support zone located between the key support level 335.00 (which has been reversing the price from April) an...
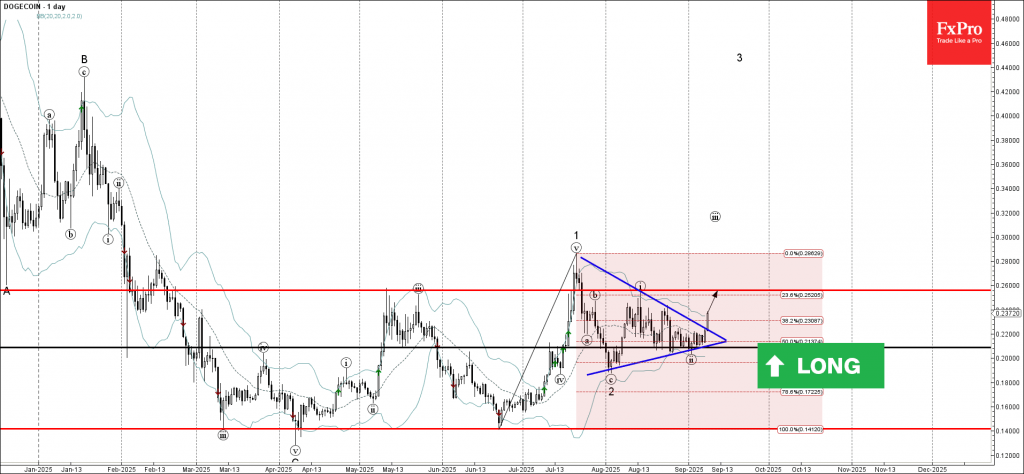
Dogecoin: ⬆️ Buy– Dogecoin broke daily Triangle– Likely to rise to resistance level 0.2600Dogecoin cryptocurrency recently broke the resistance trendline of the daily Triangle from the middle of July.The breakout of this Tri...
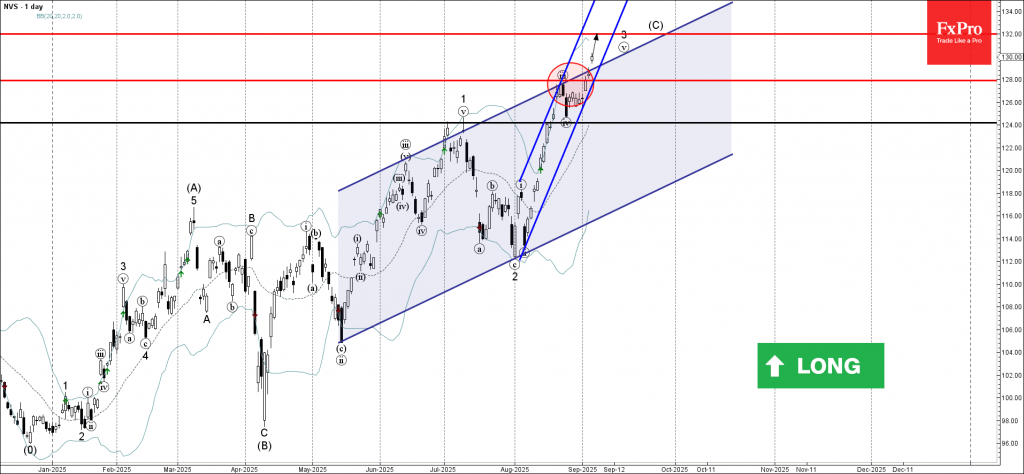
Novartis: ⬆️ Buy– Novartis broke resistance area– Likely to rise to resistance level 132.00Novartis recently opened with a sharp upward gap breaking the resistance area between the resistance level 128.00 (top of the previou...
