Analysis & Forecast

– GBPUSD reversed from support zone– Likely to rise to resistance level 1.3200GBPUSD currency pair recently reversed up from the support zone located between the pivotal support level 1.3030 (former monthly high from July), lower daily Bo...

– EURUSD broke support zone– Likely to fall to support level 1.0875EURUSD currency pair under the bearish pressure after the earlier breakout of the support zone located between the key support level 1.1000 (former monthly low from Septem...

– EURGBP reversed from resistance zone– Likely to fall to support level 0.8340EURGBP currency pair recently reversed down from the resistance zone located between the key resistance level 0.8400 (former strong support from June, July and ...

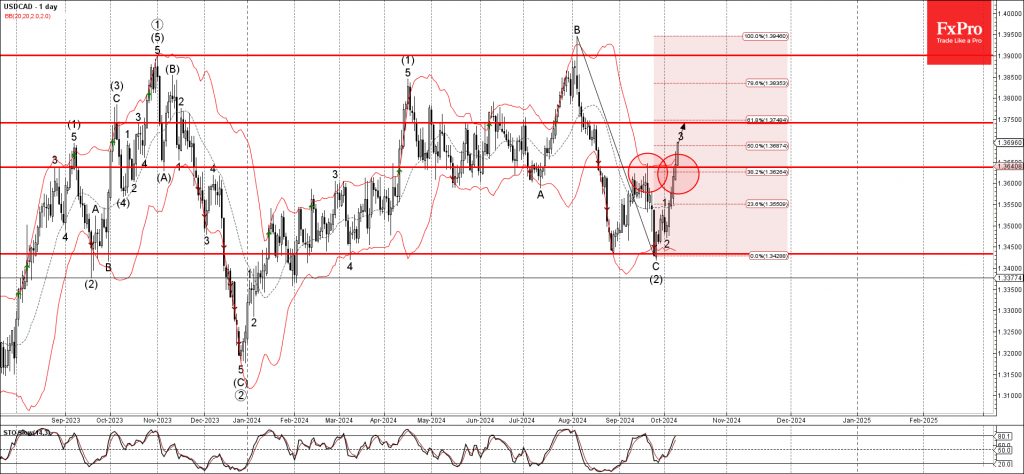
– USDCAD broke the resistance zone– Likely to rise to resistance level 1.3750USDCAD currency pair recently broke the resistance zone located between the key resistance level 1.3635 (former monthly high from September) intersecting with th...

– Gold broke the support zone– Likely to fall support level 2580.00Gold recently broke the support zone set between the support level 2625.00 (which stopped wave A at the end of September), the support trendline of the daily up channel fr...

IBM broke resistance zone Likely to rise to resistance level 240.00IBM continues to rise strongly after the earlier breakout of resistance zone located between the resistance level 220.00 and the resistance trendline of the wide weekly up channel fr...

– Nasdaq-100 reversed from support zone– Likely to rise to resistance level 20340.00Nasdaq-100 index today reversed up from the support zone located between the pivotal support level 19680.00 (former top of wave b from the start of Septem...

– Adobe broke round support level 500.00– Likely to fall to support level 470.00Adobe recently broke the support zone located between the round support level 500.00 (monthly low from August) intersecting with the 61.8% Fibonacci correctio...

– WTI under strong bullish pressure– Likely to rise to resistance level 78.3WTI crude oil under the strong bullish pressure after the price broke the resistance level 71.30 (former strong support from August) intersecting with the resista...

– Natural gas reversed from long-term resistance level 3.150– Likely to fall to support level 3.0000Natural gas recently reversed down from the long-term resistance level 3.150 (the previous month’s high from May and June).The resis...
