Category Archives: Forex Strategies


You must learn how to trade the pivot points trading strategy the right way if you want to take full advantage of the power behind pivot points. Trading pivot points is the ultimate support and resistance strategy. It will eliminate the subjectivity ...
Scalping is one of the most popular trading strategies in the forex market. It is a technique that aims to obtain profits by quickly opening and closing positions. To be successful at scalping, traders must have in-depth knowledge of the market, as w...
The world of Forex trading is vast, dynamic and constantly evolving. With the movements and changes of the global economy, traders are always looking for trading strategies that can help them navigate the turbulent waters of the forex market....
Many academics will tell you that markets are random and efficient. And as a result, there is no point in trying to predict the price of any financial security. On the other hand, there is an opposing opinion that holds that price movements can be pr...
The candlestick pattern analysis method has evolved to become one of the most popular technical analysis tools in the Forex market....
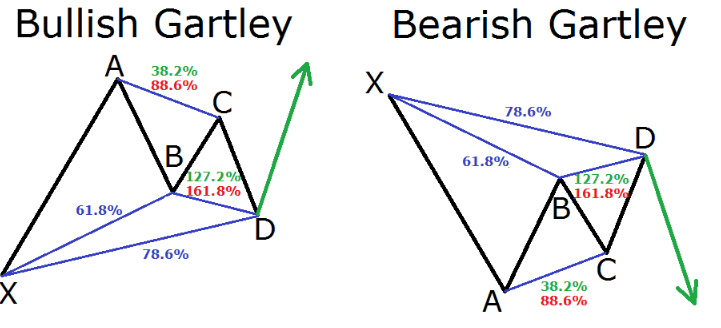

The zig-zaging moves of the forex market have confounded traders since the beginning of exchanges. While some dismiss technical analysis as no better than reading tea leaves, the Gartley pattern has demonstrated that methodical analysis of price acti...

Have you ever felt like you were swimming against the current when trading Forex?You're not alone.Going against the dominant market trend can be tricky, but counter trading strategies allow savvy traders to profit in any market condition.Counter ...

Trading currencies and watching the forex markets move without being able to capitalize on price swings is beyond frustrating. But what if I told you that with the right momentum trading strategies, you can actually profit from market volatility?In t...

In the ever-evolving landscape of the foreign exchange (forex) market, traders constantly seek an edge. While a diverse arsenal of technical analysis tools exists, some find their compass in the raw pulse of the market itself: price action trading st...

As a beginner trader producing consistent profits in the financial markets, I desperately searched for the perfect trading strategy. I wanted to find a particular strategy that could help me capitalize on opportunities in forex, stocks, commodities, ...