 Alpari
 XM
XMConsumer spending, too, slips as high-interest rates reduce demand for goods
The personal consumption expenditures price index was unchanged in October after rising 0.4% the previous month as the cost of goods and services remained flat, data released by the US Bureau of Labor Statistics (BLS) showed. Year-on-year, the headline index stood at 3.0%, down from 3.4% in September, the lowest since February 2021.
On the other hand, the core PCE price index, which ignores volatile food and energy prices, rose by 0.2% month-on-month in October from 0.3% last month, in line with Street estimates. On an annual basis, the gauge slowed from 3.7% to 3.5% in October.
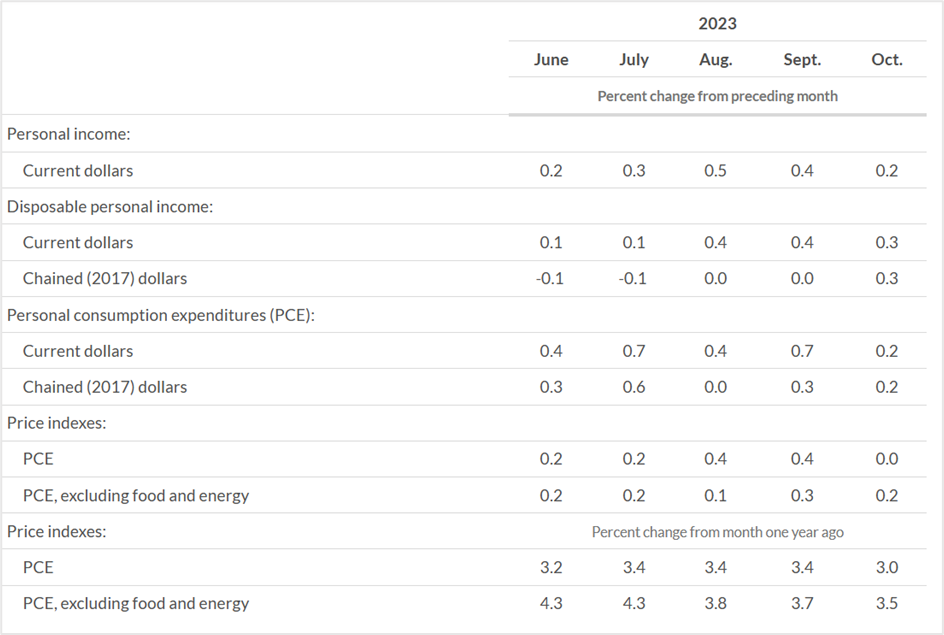
The drop in the headline PCE price index is primarily due to a 2.6% plunge in energy prices in October. However, food prices registered a slight 0.2% increase. In addition, personal income rose by 0.2% for the month from 0.4% in September, while consumer spending increased by a tiny 0.2% in October from 0.7% the previous month. All these numbers have helped keep inflation in check and should be enough for Fed policymakers to hold off further rate increases.
Inflation has steadily declined over the past few months after the US central bank rolled back its easy monetary policy to jack up benchmark interest rates from near zero to more than two-decade highs of 5.5% in 18 months. The rapid pace of rate increases is finally showing signs that high borrowing costs are cooling the US economy. Although inflation remains above the Federal Reserve’s 2% target, senior central bank officials and economists believe it will likely hit the target within a couple of years.
Market participants generally monitor the Labor Department’s consumer price index as the preferred inflation gauge, whereas the US central bank favors the PCE price index reading. While the CPI measures the cost of goods and services across a broad spectrum of components, the PCE focuses on what people spend and adjusts for consumer behavior during price fluctuations.
Key highlights of the October PCE price index
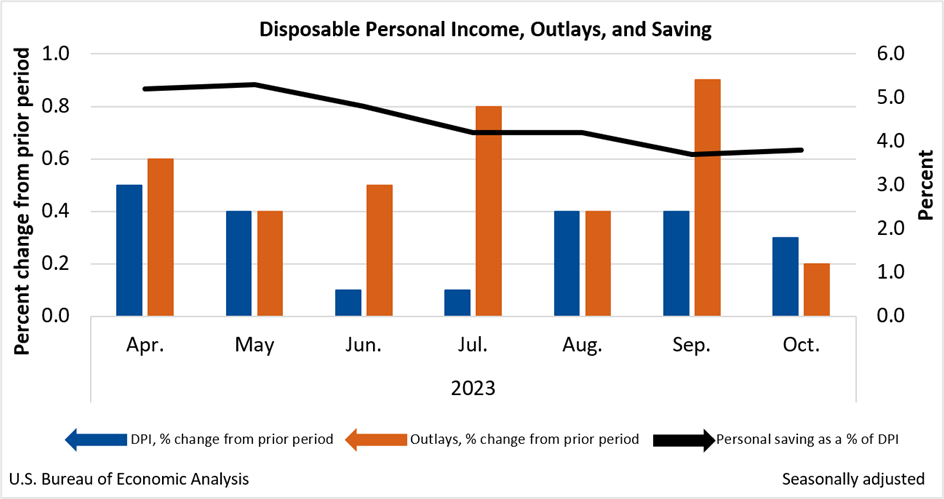
In current dollar terms, personal income increased by $57.1 billion or 0.2% in October. Meanwhile, disposable personal income (DPI), the net personal income after tax deductions, rose by $63.4 billion or 0.3%, and personal consumption expenditures (PCE) improved by $41.2 billion or 0.2%.
Compared to the previous month, prices for goods slid 0.3% while prices for services rose 0.2%. Also, as mentioned earlier, food prices increased by 0.2%, and energy prices dropped by 2.6%. Over 12 months, goods prices rose 0.2%, prices for services jumped 4.4%, food prices climbed 2.4%, and energy prices fell 4.8%.
On the other hand, the core PCE price index in October showed a 0.2% increase in spending on services and 0.1% on goods. Within services, the most significant contributors to the increase in real PCE were other services, led by international travel, while in the healthcare sector, hospital and nursing home services showed the increases. In addition, the cost of food services and accommodations also rose. Within goods, the biggest contributors to the increase were gasoline and other energy goods.
Economists’ review of the US PCE index
Scott Anderson, the chief economist of the Bank of the West, thinks there are signs that consumers are becoming price-conscious. But he doesn’t see a sharp downturn in consumer spending that could trigger a recession.
Bill Adams, the chief economist at Comerica Bank, sees signs of cooling inflation and a faster-than-expected job market slowdown. He believes that although the Fed is holding on to interest rates currently at more than two-decade highs, they are close to a pivot toward lower rates.
Market reaction to the PCE price index news
The US stock markets were mixed on Thursday, with the Dow Jones Industrial Average soaring to 2023 highs, backed by cooling inflation and solid quarterly earnings from Salesforce. The 30-stock index closed at 35,950.89, gaining 520 points or 1.47% for the session. The price-weighted index rose 8.9% in November to cap a three-month losing streak.
Meanwhile, the S&P 500 climbed 0.38% to 4,567.80 to end the month with gains of 8.92%, while the Nasdaq 100 slipped 0.25% to end Thursday’s session at 15,947.87, up 10.67% in November. Profit booking drove the tech-heavy index lower, but despite this, the S&P 500 and the Nasdaq 100 have registered the best monthly gains since July 2022.
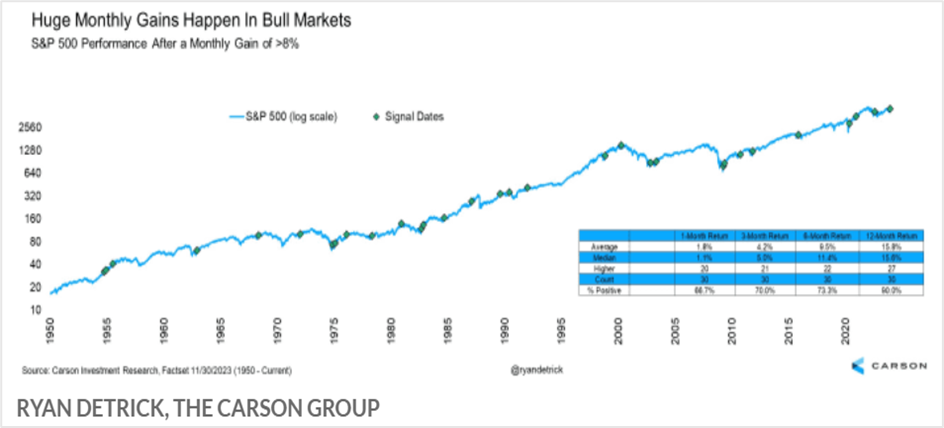
Ryan Detrick, the chief market strategist at the Carson Group, believes that the gains in the equities markets will likely extend in December and into next year. His analysis dates back to 1950 when the rally in the S&P 500 continued the following month 90% of the time after the index registered a monthly gain of 8% or more in the preceding month.
The US dollar rose against its major counterparts on Thursday. The US dollar index (DXY), which tracks the greenback against a basket of six currencies, surged 0.71% to end Thursday’s session at 103.497, a five-session high amid short covering. Despite Thursday’s gains, the US currency is down 2.97% in November, recording the first monthly loss in four and the worst performance in a year amid signs that the US economy is decelerating from the sharp hike in interest rates and news that the Fed could soon pivot to cutting rates.
Ulrich Leuchtmann, the head of foreign exchange research at Commerzbank, expects the US dollar to weaken over the next two quarters, especially if it becomes evident that the Federal Reserve might start cutting interest rates.
Treasury yields rose across maturities on Thursday despite the Fed’s preferred inflation gauge cooling in October. The yield rate-sensitive 2-year Treasury Note surged 0.77% to 4.684%, while the yields on the benchmark 10-year Note climbed 1.62% to 4.328%, and the 30-year bond rose 1.31% to 4.498%. Despite the rebound in yields, November was one of the best-performing months for bonds in almost 40 years, triggered by expectations of rate cuts in 2024.
Meanwhile, fresh interest in US government debt in November drove the 10-year Note and 30-year bond yields to the biggest monthly decline since August 2019.
Technical view
Salesforce Inc (CRM)
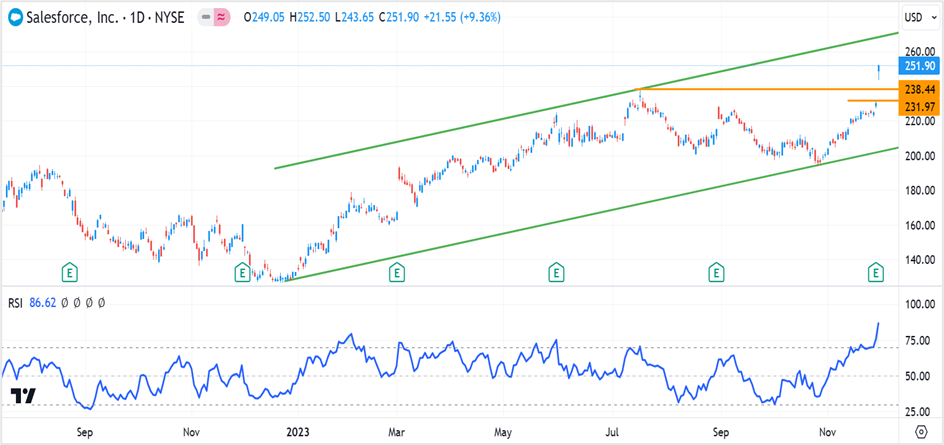
Shares of Salesforce jumped 9.36% to settle at $251.90 on Thursday, registering the highest close since January 3rd, 2022, after the company announced fiscal third-quarter results in line with Street estimates. CRM opened above key resistances and July highs of $238.22 and continued to ride on the good news to settle near the day’s highs.
The stock is currently in no man’s land, with the gains likely to extend to $270.00 from here or dip to the support zone of $232.00-$239.00 before rebounding. Buy the stock at $239.00, and continue accumulating on declines toward $232.00 with a combined stop loss at $226.00 and exit as prices approach $270.00. However, if the stock continues to rally without a pullback, initiate short positions at $270.00, with a stop loss at $276.00 for a profit target of $240.00.
Salesforce Inc- Daily chart
Click the link to view the chart- TradingView — Track All Markets
Light crude oil futures (CLF24)
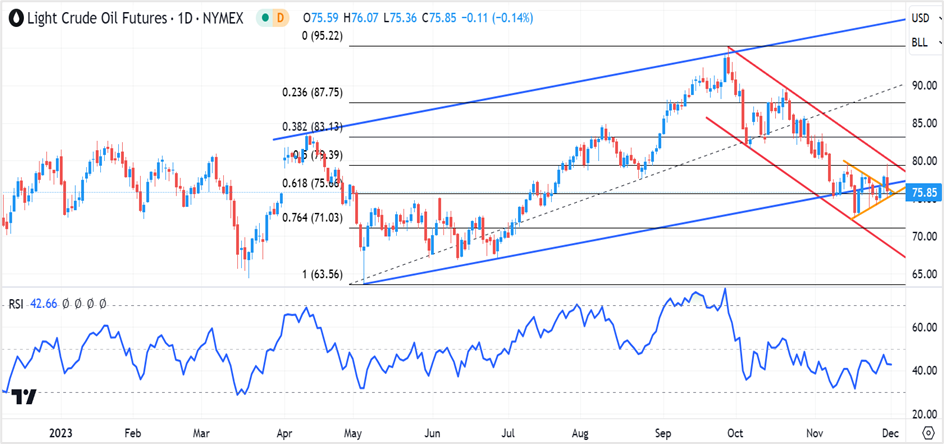
January crude oil futures closed at $75.96 a barrel on Thursday in a volatile session that saw prices swing in the $75.00-$80.00 range multiple times during the session. Over the past three weeks, oil has oscillated in a tight $72.00-$80.00 band, with prices mainly concentrated in the $74.00-$78.00 range, breaking above and below the long-term bullish support on multiple occasions.
On charts, the immediate support is at $75.50, coinciding with the 61.8% Fibonacci retracement. A close below the support and prices could slide to $68.00-$69.00. On the upside, resistances are in the $77.00-$79.00 zone, a close above which prices could surge to $83.00-$87.00, followed by $100.00.
Initiate long positions at $75.00, with a stop loss at $74.00 for a profit target of $79.00. Long positions can also be initiated if oil closes above $79.00 or breaks $80.00. Place a stop loss at $78.00 and exit as prices approach $87.00. On the downside, short oil if prices breach $74.00. Place a stop at $76.00 and exit at $69.00.
Light crude oil futures- Daily chart
Click the link to view the chart- TradingView — Track All Markets