Alpari
 XM
XMManufacturing output too falls, while September’s output is revised lower
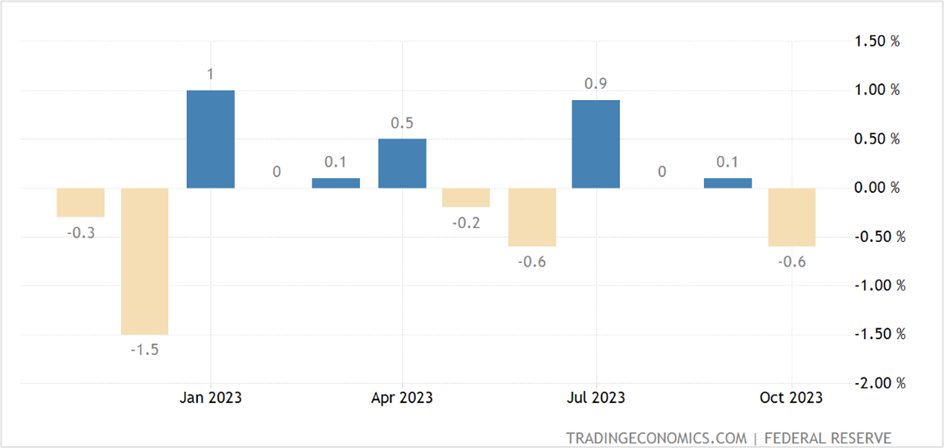
Production at US factories fell 0.6% in October amid a slump in motor vehicle output resulting from the United Auto Workers (UAW) strike against the Big Three car manufacturers, the US Federal Reserve announced on Thursday. Compared to the same time last year, industrial production was down 0.7%.
The decline in industrial output was much higher than the 0.4% drop expected by economists surveyed by The Wall Street Journal.
US industrial production-month-on-month
Meanwhile, manufacturing output slid 0.7% last month, with September’s figures revised lower to 0.2% from 0.4% reported earlier. Year-on-year, manufacturing production fell 1.7% in October. However, excluding motor vehicles and parts, manufacturing output edged higher by 0.1%. Manufacturing accounts for more than 11% of the US economy, and with interest rates at more than two-decade highs, the sector has been reeling from high borrowing costs, with business spending on equipment plunging in the third quarter.
Capacity utilization for the total industrial sector, a measure of how much firms use their resources, slipped from 79.5% in September to 78.9% last month and is currently at eight-tenths of a percentage point below its 1972-2022 average. On the other hand, the operating rate in the manufacturing sector dropped from 77.8% to 77.2% during a similar period and is one percentage point below its long-run average.
Key highlights of the industrial production report
The sharp drop in industrial output came from a 10% tumble in motor vehicles and parts output, mainly affected by the strikes called by the United Auto Workers (UAW) at several major motor vehicle manufacturers. Excluding motor vehicles and parts, the index for manufacturing ticked 0.1% higher. Meanwhile, the index for utilities decreased by 1.6%, and the output of mines increased by 0.4%.
Coming to market groups, the index for consumer durables plummeted 5.8%, led by a 10.3% fall in the index for automotive products, while the output for consumer nondurable goods edged 0.1% higher. Another negative reading came from the output of business equipment, which dropped 0.5% due to a decline in the transit component. On the other hand, the index for defense and space equipment surged by 1.7%, its 10th consecutive monthly increase, while the index for construction supplies rose by 0.2%, and business supplies slid by 0.4%. Within materials, the most significant drop was seen in durable materials, which include automotive parts.
Lastly, among industry groups, the index for durable manufacturing fell 1.3% in October, the index for nondurable manufacturing slipped 0.1%, and other manufacturing (publishing and logging) moved 0.5% higher. Within durable manufacturing, the output of motor vehicles and parts slumped by 10%, with decreases also seen in the indexes for primary metals (1.7%), furniture, and related products (1.4%). On the contrary, the major output increases were in computer and electronic products (1.9%), and electrical equipment, appliances, and components (1.5%).
Within nondurable manufacturing, gains were seen in the indexes for petroleum and coal products (2.2%) and paper (0.7%). These were offset by declines in the indexes for plastics and rubber products (2.2%) and chemicals (0.6%). Meanwhile, mining output rose 0.4% and was 2.2% higher over 12 months. In contrast, the index for utilities slid 1.6% in October but was 2.9% higher year-on-year.
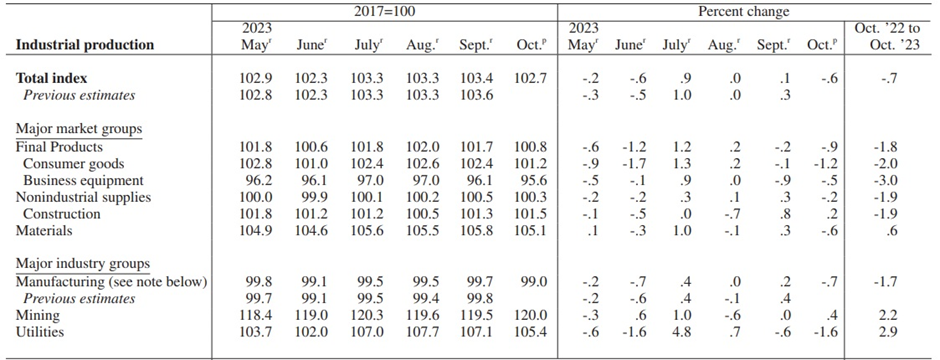
Source: Federal Reserve
Economists’ reaction to the industrial sector report
Rubeela Farooqi, the chief US economist at High-Frequency Economics, thinks the outlook for factory output is uncertain due to the high borrowing costs and weak demand for goods. However, she expects demand to stabilize at lower levels. In addition, Rubeela believes that onshoring of supplies and spending on infrastructure could support factory activity over the near term.
Market reaction to the factory output news
US equities swung between gains and losses to end mixed on Thursday. The Dow Jones Industrial Average closed 0.13% lower at 34,945.47, the S&P 500 rose 0.12% to 4,508.24, and the Nasdaq 100 ended 0.10% higher at 15,833.17.
The US stock markets have been on a roll since the last week of October after some market-positive economic data, including the non-farm payrolls and inflation reports, reversed what looked like another long-drawn bearish move in equities. The key stock market benchmarks are on course to end the third successive week with gains, the first in several months.
According to the US options markets analytics provider Asym50, $2.4 trillion in options tied to stocks, exchange-traded funds (ETFs), and equity indices will expire on Friday, November 17th, with a surge in bullish bets likely to drive stock prices higher. Click HERE for more information.
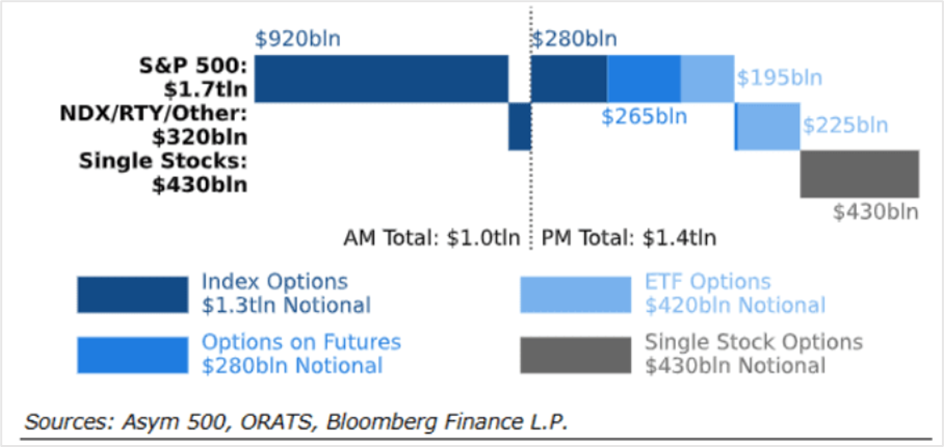
Source: MarketWatch
Also, Lawrence G. McMillan, the president of McMillan Analysis and an investment and commodity trading advisor, believes that the S&P 500 has decisively broken out on the upside, and if 4540 and 4600 levels are taken out, it could rally as high as 4800.
In the US Treasury markets, yields fell across maturities on Thursday as investors piled into government securities amid expectations that the Fed’s rate hiking cycle has ended and that cooling inflation will likely push the Federal Reserve to cut rates earlier than expected next year.
Economic data on Thursday revealed a 0.8% fall in import prices in October, while the jobless rate climbed by 13,000 last week. Also, the October PPI report on Wednesday showed a surprise 0.5% drop in wholesale inflation from a 0.4% increase in September.
Will Compernolle, a macro strategist at FHN Financial, believes that worsening growth sentiment is pushing yields further away on the Treasury market curve.
In the currency markets, the US dollar index closed flat at 104.35 on Thursday, holding below key support at 104.50 for the third successive day. With geopolitical tensions easing somewhat and the US central bank unlikely to raise interest rates again this cycle, the greenback is under pressure as investors exit long dollar positions, driving the currency index toward a weekly loss.
The dollar closed flat against the euro and the pound sterling at 1.0851 and 1.2413, correspondingly, while it fell 0.39% to 150.72 versus the Japanese yen.
Meanwhile, the Japanese yen is on track to register the best weekly gain against the dollar in four months on the prospect of a narrower US-Japan rate differential. While investors think the Bank of Japan is readying markets to end negative interest rates, some currency strategists believe the Japanese central bank will not meddle with policy settings anytime soon.
Technical View
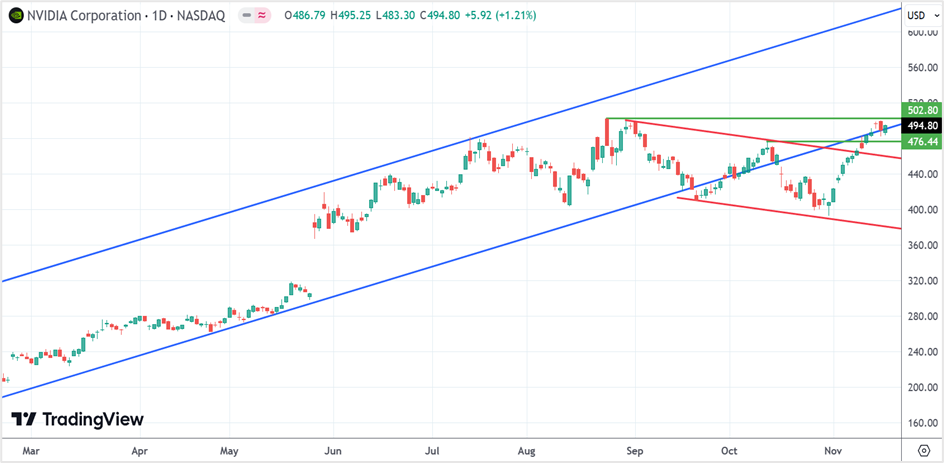
Nvidia Corp (NVDA)
NVDA ended Thursday’s session at $484.80, up 1.21%. Last week, the stock broke out of key resistance to close above the October high of $476.00 to jump right back into the long-term bullish channel. The near-term support for the stock is in the $479.00-$485.00, with immediate resistance at the all-time high of $502.66. The gains will likely extend to $503.00 in the near term, and a close above should trigger a further upside of 20-25% as the stock heads toward the resistance line of the long-term bullish channel at $600.00-$620.00. However, if prices close below $476.00, the bullish view will be negated.
Buy Nvidia in the $480.00-$485.00 range, with a stop loss at $472.00 for a profit target of $503.00. Long positions can also be initiated if the stock closes above $505.00, with a stop loss at $480.00 for a profit target of $600.00-$620.00. Trail your profits once prices surge above $550.00.
Click the link to view the chart- TradingView — Track All Markets
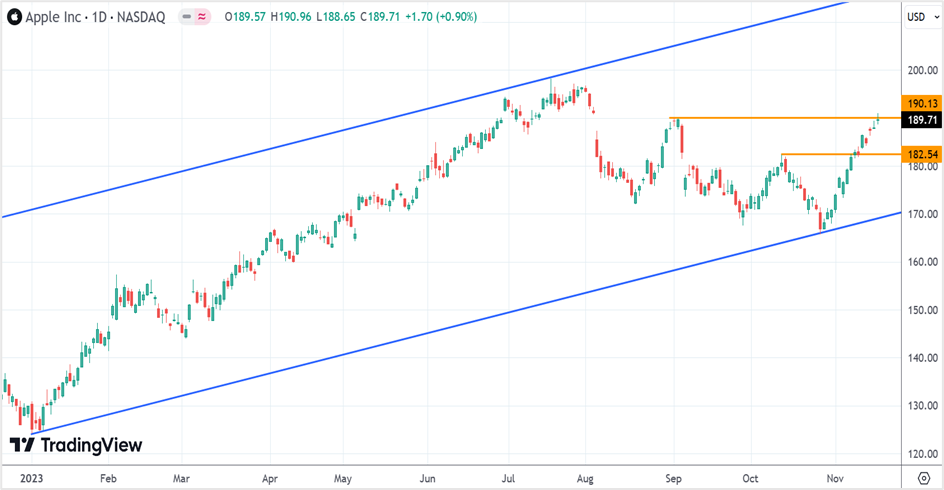
Apple Inc. (AAPL)
AAPL closed 0.90% higher at $189.71 on Thursday. Earlier this month, the stock broke out of the medium-term bearish trend at $177.00 to hold near the short-term resistance and the September high of $190.00. The stock tested the resistance level on Thursday and failed to close above it, but it could only be a matter of time before Apple shares settle above the level and extend gains toward $215.00, the long-term bullish channel resistance. On the downside, the near-term support is at $182.00-$182.50, which could be good entry points if the stock drops from the current level. As long as prices hold above this support, the trend remains bullish.
Buy AAPL at $182.00-$183.00, with a stop loss at $178.00 for a profit target of $190.00. You can also initiate long positions on the stock if it closes above $190.00 or breaks $195.00. Place a stop loss at $184.00 and exit as prices approach $215.00.
Click the link to view the chart- TradingView — Track All Markets