 Alpari
 XM
XMTransportation equipment & new durable goods orders topped the declines
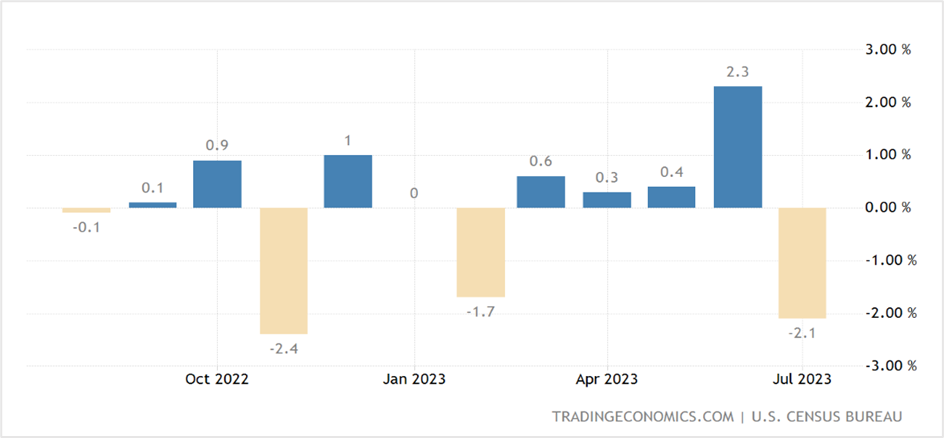
New orders for manufactured goods fell by $12.7 billion or 2.1% in July to $579.4 billion from 2.3% the month earlier, the US Census Bureau reported on Tuesday, 5th September 2023. Excluding transportation, orders rose 0.8% in July, up from 0.3% the previous month. Economists surveyed by The Wall Street Journal expected a 2.3% drop in factory orders as high interest rates pushed businesses to reduce spending on equipment.
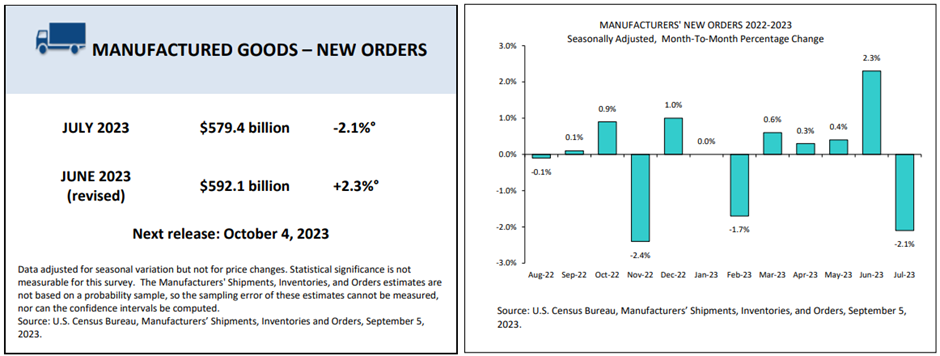
Key highlights of the US Factory Orders Report
The factory orders data released by the US Census Bureau comprises four components- New Orders, Shipments, Unfilled Orders, and Inventories. Here's how they performed-
New orders for manufactured durable goods like cars, appliances, and factory equipment plunged by $15.7 billion or 5.2% to $285.5 billion, unchanged from the advanced report, after a 4.3% jump in June. One of the reasons for the sharp fall in demand for bellwether consumer durable goods could be attributed to the plunge in the highly volatile new aircraft orders reported by Boeing. Transportation equipment drove the fall in factory orders, tumbling by $16.5 billion or 14.3% to $98.6 billion, following four consecutive monthly gains. On the other hand, new orders for manufactured goods rose by $3.1 billion or 1.1% to $293.9 billion.
Shipments of manufactured durable goods slipped 0.1% or $0.2 billion to $283.3 billion in July after two successive monthly increases. Transportation equipment drove the drop with a 0.3% or $0.3 billion decline, while shipments of manufactured goods increased by 1.1% or $3.1 billion to $293.9 billion.
Unfilled orders for manufactured goods ticked higher by 0.5% or $7.2 billion, up seven of the last eight months. Transportation equipment, likewise, is also higher seven out of eight months, surging 0.8% or $7 billion in July.
Lastly, inventories of manufactured durable goods were unchanged in percentage terms but dropped $0.3 billion in July, while transportation equipment led the decrease, after it slipped by $0.2 billion or 0.2%, both falling for the second consecutive month. Contrarily, inventories of manufactured nondurable goods rose by $0.9 billion or 0.3% in July from a 0.4% drop in June, led by an increase in petroleum and coal products, up $1.8 billion or 4.1%. Among inventories in the fabrication stage, July materials and supplies increased 0.1% for durable and nondurable goods. Work in process slid 0.1% in durable goods and surged 1.4% in nondurable goods. Finished goods dropped 0.2% in durable goods and 0.1% in nondurable goods.
The US Factory Orders follow the Caixin China PMI Services Index, which was released on Monday and showed service activity in China slowed to eight-month lows of 51.8 in August, down from 54.1 in July. Also, the HCOB's final Composite Purchasing Managers' Index (PMI) for the eurozone, compiled by S&P Global and published on Tuesday, dropped by 46.7 in August from 48.6 a month earlier, the lowest since November 2020.
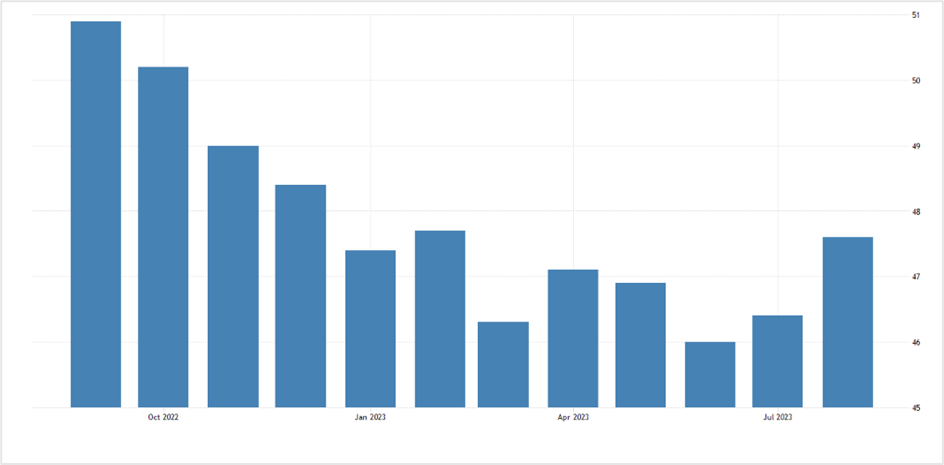
Also, last Friday, the US August Manufacturing PMI released by the Institute for Supply Management (ISM), the other measure of manufacturing activity, fell to 47.6% from 46.4% in July, contracting for the tenth straight month, indicating that the manufacturing sector is indeed experiencing a slowdown.
US ISM Purchasing Managers Index (PMI)
The report on the US Factory Orders is compiled from the US Census Bureau's survey on Manufacturers' Shipments, Inventories & Orders, also called the M3 survey. The survey provides monthly statistics about the manufacturers' value of shipments, new orders excluding cancellations, order backlogs, or unfilled orders at the end of the month, the market value of the end-of-month total inventory, and fabrication stage inventories, such as materials and supplies, work-in-process, and finished goods.
The M3 survey is based on a panel of about 5,000 reporting units comprising around 3,100 companies, presenting the month-to-month change in the manufacturing sector across 92 industry categories.
Economists view on the July Factory Orders numbers
The co-head of US Economics at S&P Global Market Intelligence, Chris Varvares, believes that the manufacturing sector has struggled since last year. While it has not declined rapidly, new orders have not increased much. He thinks the fall in the July orders was primarily due to the volatile aircraft orders, the long lead times, and the high price tags associated with them. He thinks it's better to gauge durable goods orders by excluding transportation, which grew by a modest 0.5% in July.
Market reaction to the July Factory Orders report
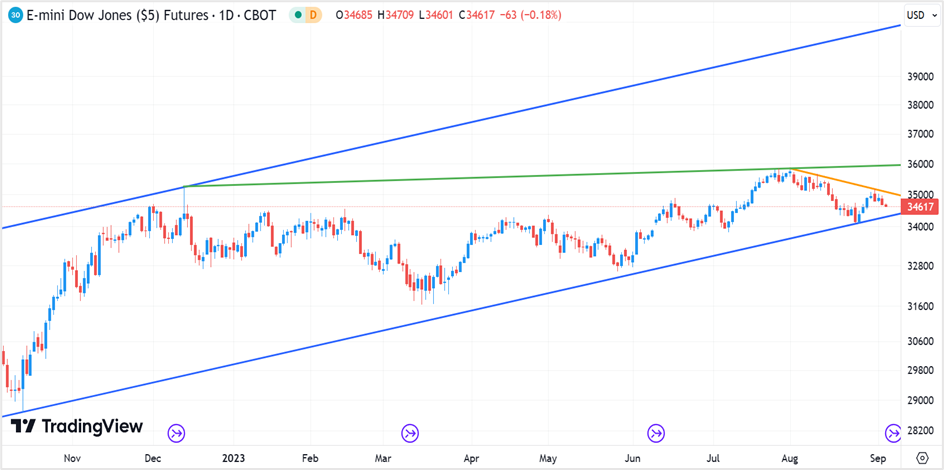
The US equities markets were mixed on Tuesday, with the benchmark S&P 500 and the Dow Jones Industrial Average closing lower by 0.42% and 0.56%, respectively, while the Nasdaq 100 ticked higher by 0.11%. The three stock indices have come off the July highs and are oscillating in a tight band ahead of the all-important August CPI data on 13th September. Volumes remain subdued across stocks and stock index futures with a few exceptions.
September is generally not a good month for US equities. According to data from CFRA Research, the S&P 500 has delivered an average monthly return of 0.73% since 1945. Some investors hope that this month might not be bad for equities given the strength in the US economy, but others are concerned about the ugly combination of easing growth and the likelihood of inflation climbing again.
E-mini Dow Jones Futures- Daily chart
In the forex markets, the greenback rose by 0.55% against its key counterparts in the US dollar index to end Tuesday's session at 104.80, registering the highest close since 9th March 2023. The US currency has been on a roll, ending the seventh successive week with gains, the first since 2014, as the major global economies continue to struggle from a mix of low growth, high inflation, and interest rates. On the other hand, the US economy looks to be in better shape, with most data pointing to economic growth expanding at a modest pace, reflecting the gains in the US dollar.
Technical View
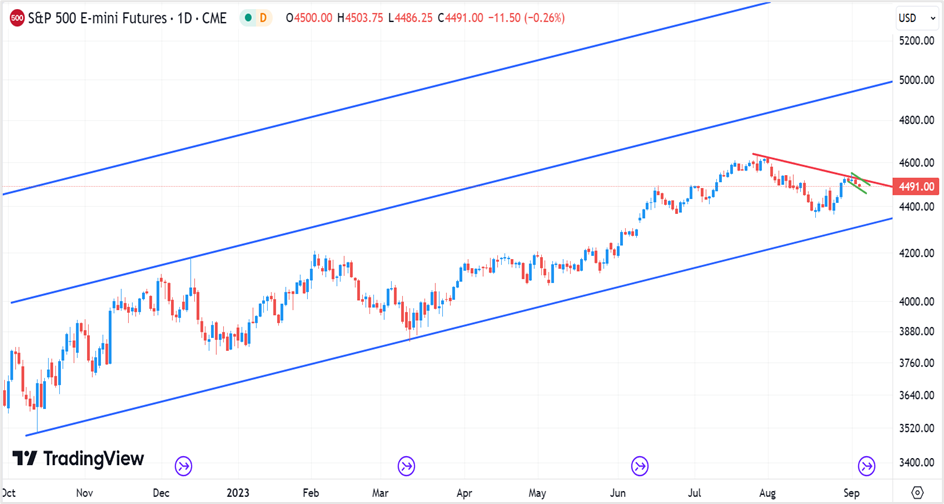
The S&P 500 September futures are consolidating after pulling back from key resistance at 4530 (red trendline), and from the look of it, the benchmark index futures might be forming a flag pattern (indicated by the green trendlines), with the breakout corresponding to the resistance @ 4530. If the S&P 500 closes above this resistance, the index futures could extend gains to 5000, illustrated by the middle blue trendline.
The trading strategy will be to go long on the index futures if they close above the resistance or surge above 4550. Place a stop loss @ 4500 and exit as the index futures approaches 5000.
S&P 500 E-mini Futures- Daily chart
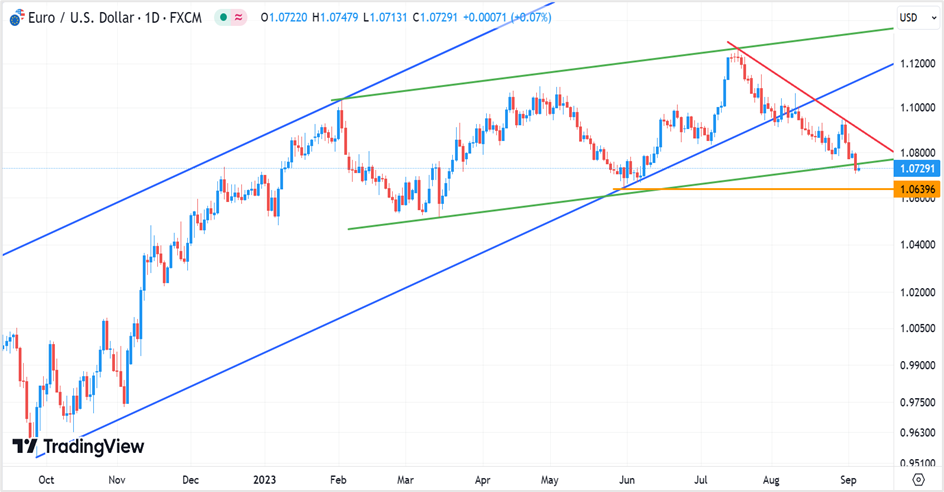
The EUR/USD pair is in a primary downtrend after settling below crucial long-term support in early August this year- illustrated by the lower blue trendline. The pair also closed below the medium-term support at 1.0750 (indicated by the lower green trendline), while the short-term trend also points to further weakness in the euro, with the downtrend likely to extend to the 31st May lows of 1.0635 (orange horizontal line).
The short-term strategy will be to short the euro at 1.0740-50, with a stop loss at 1.0780 for a profit target of 1.0650.
Spot EUR/USD- Daily chart
The Advance Durable Goods Report for August will be released on 27th September 2023, at 8:30 a.m. Eastern time, and the Full Report on 4th October 2023.