Analysis & Forecast
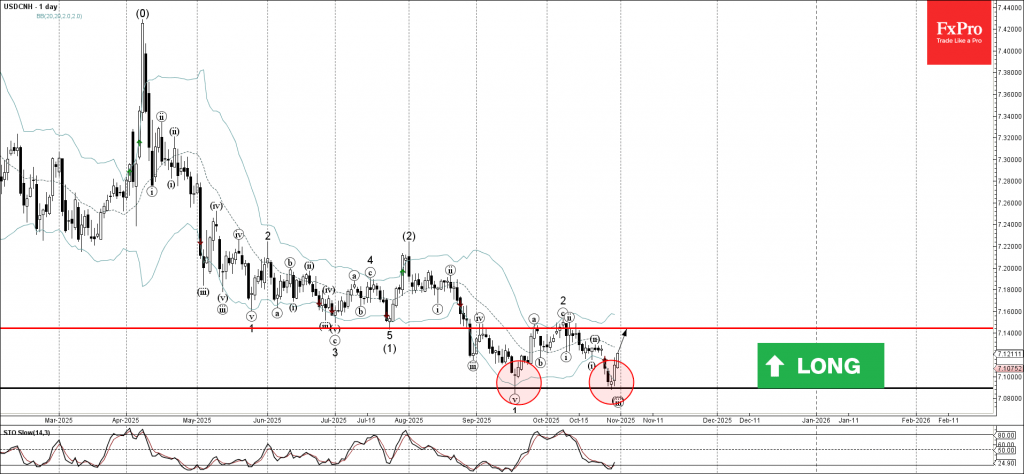
USDCNH: ⬆️ Buy– USDCNH reversed from key support level 7.0890– Likely to rise to resistance level 7.145USDCNH currency pair recently reversed from the support area between the key support level 7.0890 (which stopped the previous impul...
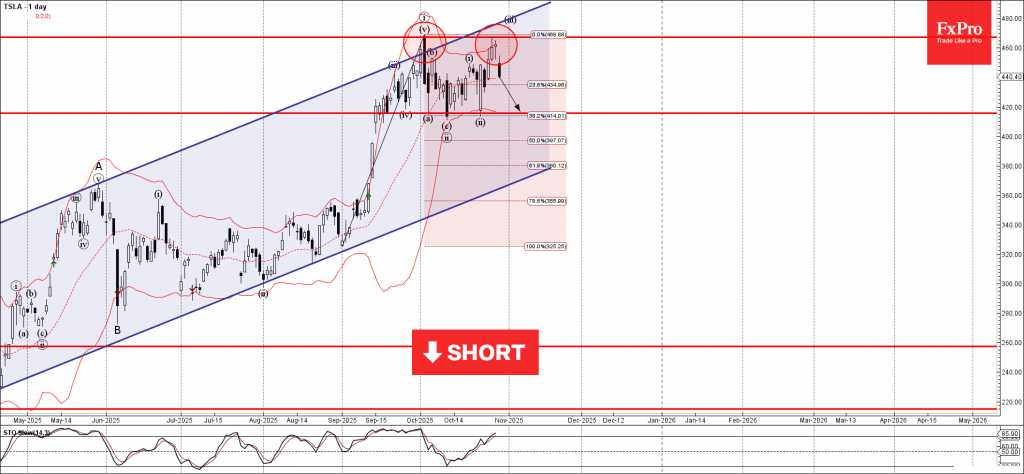
Tesla: ⬇️ Sell– Tesla reversed from the key resistance level 467.30– Likely to fall to support level 415.60Tesla recently reversed from the resistance area between the key resistance level 467.30 (which stopped the previous impulse wa...
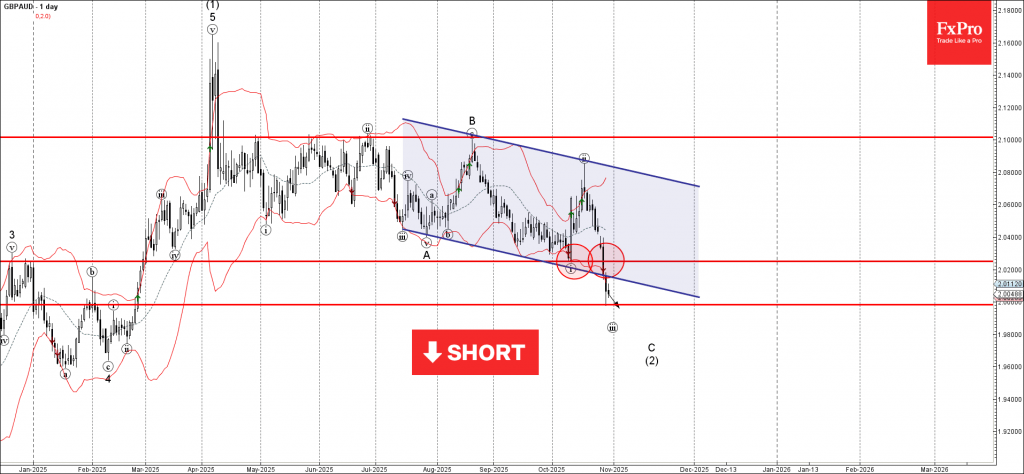
GBPAUD: ⬇️ Sell– GBPAUD broke support zone– Likely to fall to support level 2.0000GBPAUD currency pair recently broke the support zone between the support level 2.0250 (which stopped the previous impulse wave i) and the support trendl...
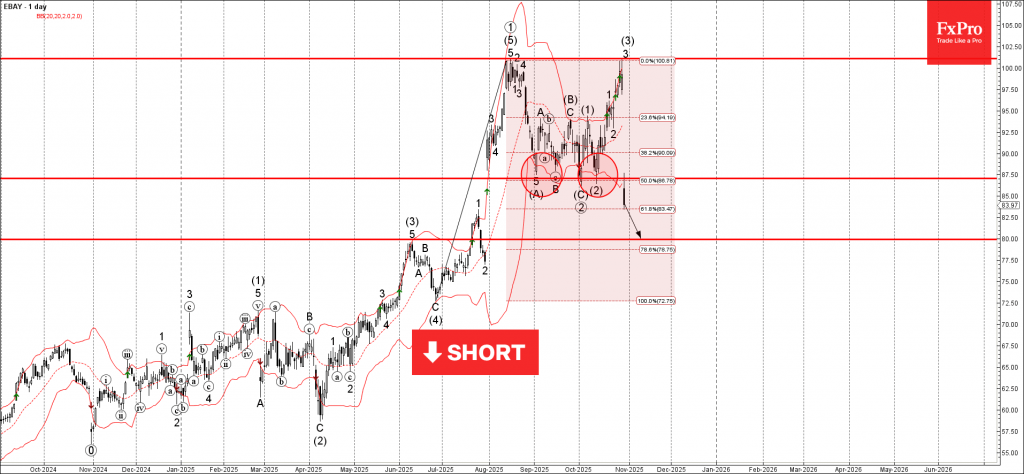
EBAY: ⬇️ Sell– EBAY broke support zone– Likely to fall to support level 80.00EBAY today opened with the sharp downward gap which broke the support zone between the support level 87.00 (which stopped multiple downward corrections from ...
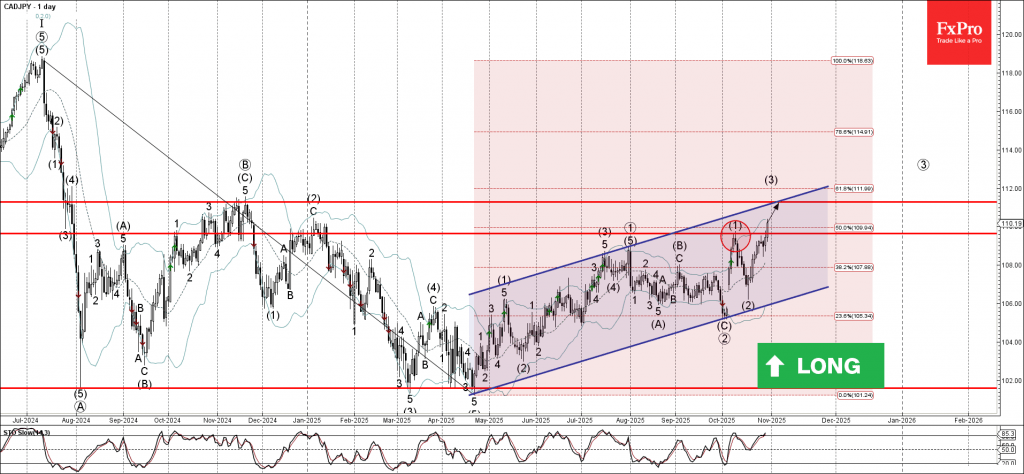
CADJPY: ⬆️ Buy– CADJPY broke resistance zone– Likely to rise to resistance level 111.30CADJPY currency pair recently broke the resistance zone between the resistance level 109.60 (which stopped wave (1) at the start of October) and th...
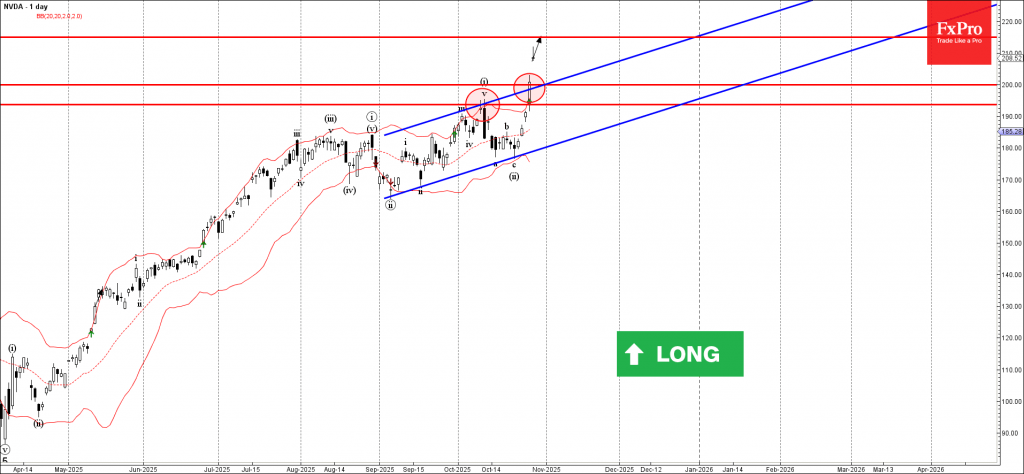
NVDA: ⬆️ Buy– NVDA opened with the upward gap– Likely to rise to resistance level 215.00NVDA stock opened today with the sharp upward gap, which follows the earlier breakout of the resistance zone between the resistance levels 19...
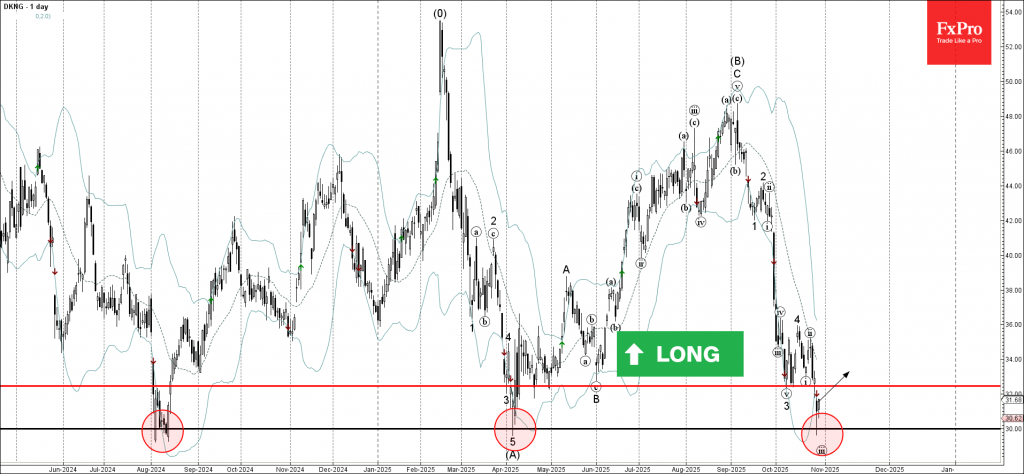
DraftKings: ⬆️ Buy– DraftKings reversed from support area– Likely to rise to resistance level 32.45DraftKings recently reversed up from the support area between the long-term round support level 30.00 (which has been reversi...
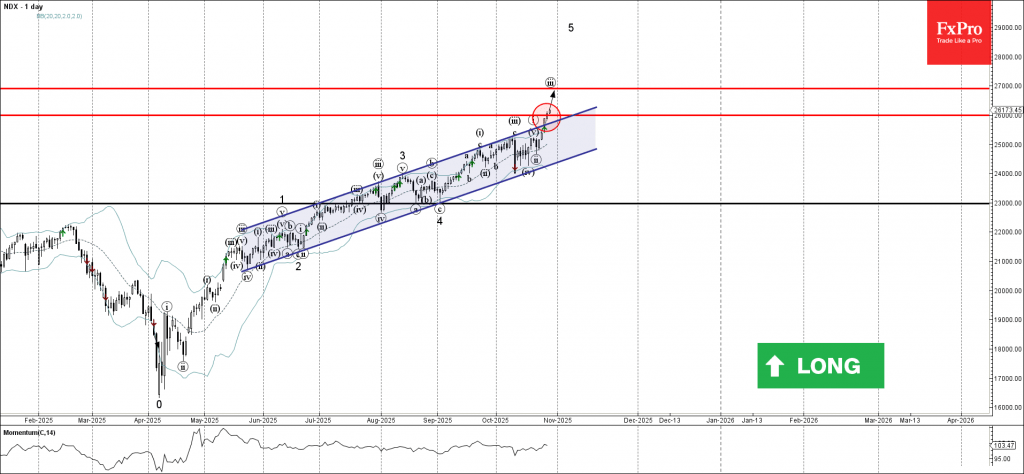
Nasdaq-100: ⬆️ Buy– Nasdaq-100 broke resistance area– Likely to rise to resistance level 27000.00Nasdaq-100 index recently broke the resistance area between the resistance level 26000.00 and the resistance trendline of the extended da...
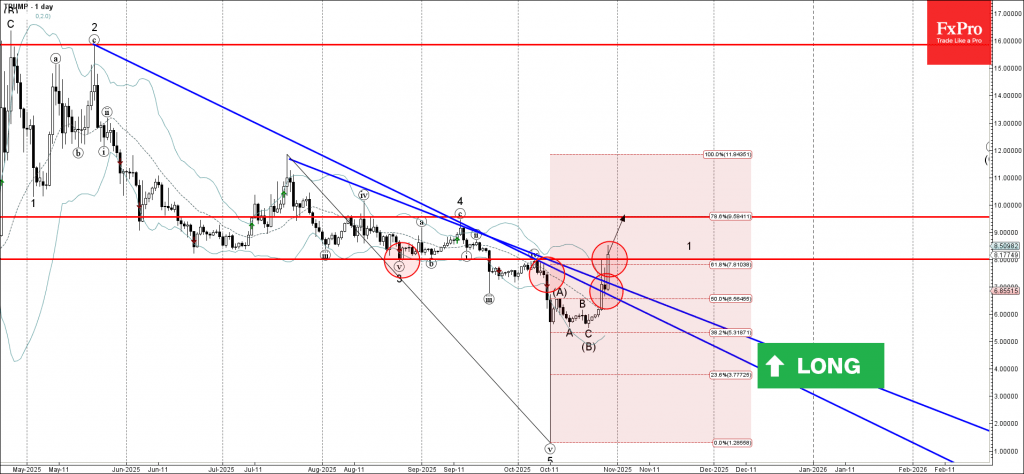
Trump Coin: ⬆️ Buy– Trump Coin broke resistance area– Likely to rise to resistance level 9.55Trump Coin recently broke the resistance area between the round resistance level 8.0000 (which stopped the previous wave iv, former strong su...
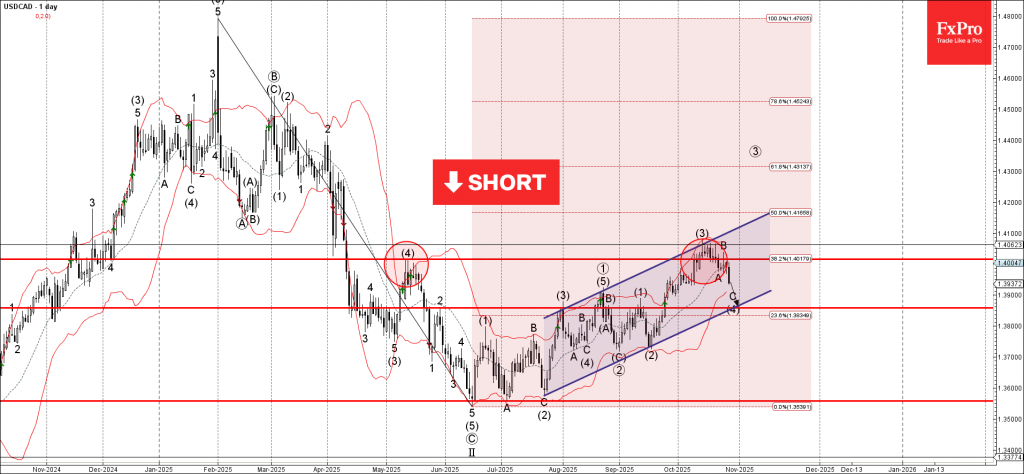
USDCAD: ⬇️ Sell– USDCAD falling inside wave C– Likely to test support level 1.3860USDCAD currency pair recently reversed down from the resistance zone between the key resistance level 1.4015 (former monthly high from May), upper daily...

 RoboForex
 Exness
 FxPro
FxPro Alfa-Forex
 Libertex
 FxGlory
 XM
XM IC Markets
 Forex.com
 AXITrader