
– NZDUSD broke long-term support level 0.5770
– Likely to fall to support level 0.5500
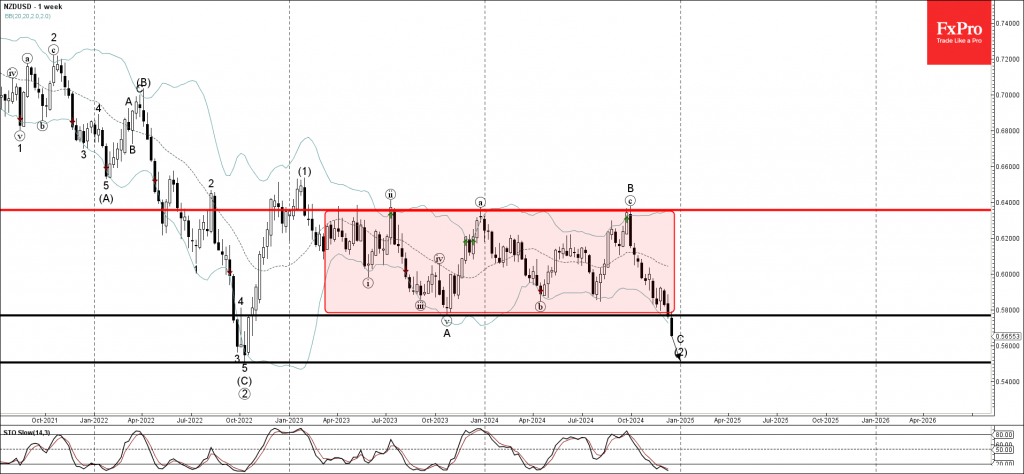
NZDUSD currency pair earlier broke below the long-term support level 0.5770 (which acted as the lower border of the weekly sideways price range inside which the pair has been trading from the start of 2023).
The breakout of the support level 0.5770 accelerated the active impulse wave C of extended downward ABC correction (2) from last year.
NZDUSD can be expected to fall further to the next support level 0.5500 (former multiyear low from 2022 and the target price for the completion of the active impulse wave C).

Source: https://fxpro.news