
NVDA: ⬆️ Buy
– NVDA reversed from the support area
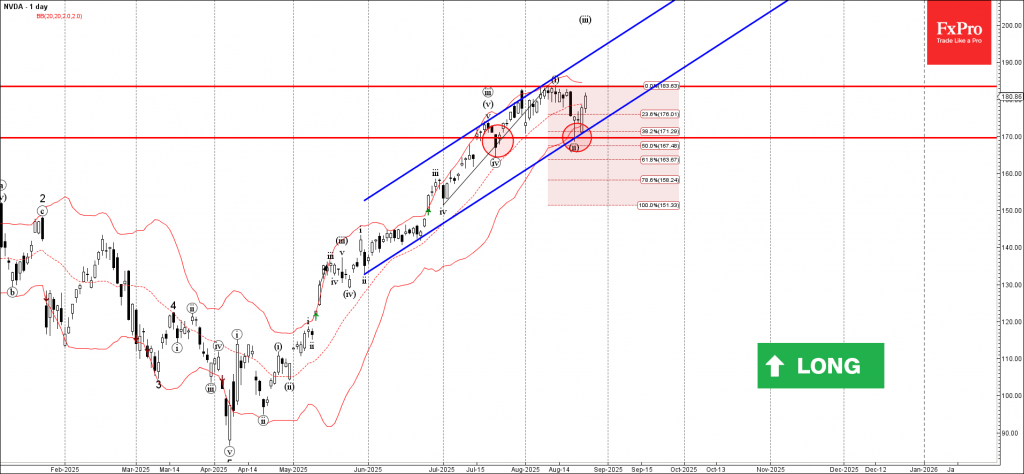
– Likely to rise to resistance level 183.45
NVDA recently reversed with the daily Hammer from the support area between the pivotal support level 170.00, lower daily Bollinger Band and the support trendline of the daily Up Channel from May.
This support area was strengthened by the 50% Fibonacci correction of the previous sharp upward impulse from the start of July.

Given the strong daily uptrend, NVDA can be expected rise to the next resistance level 183.45 (which stopped the earlier impulse wave i).
Source: https://fxpro.news