
– Nasdaq-100 reversed from support zone
– Likely to rise to resistance level 22000.00
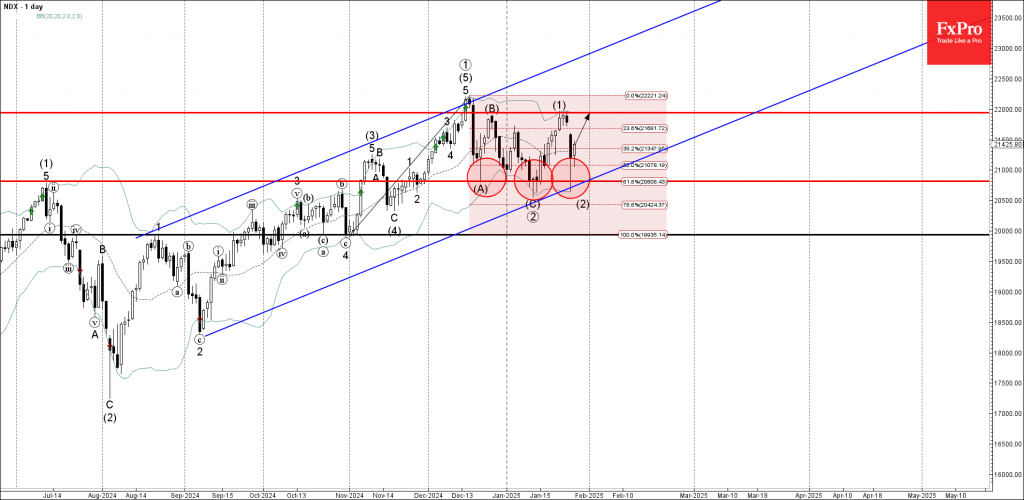
Nasdaq-100 index recently reversed up from the support zone set between the key support level 20820.00 (which has been reversing the index from December), lower daily Bollinger Band and the 61.8% Fibonacci correction of the upward impulse from November.
The upward reversal from this support zone stopped the previous intermediate ABC correction (2).
Given the strong daily uptrend, the Nasdaq-100 index can be expected to rise further to the next resistance level 22000.00 (which stopped earlier waves (B) and (1)).

Source: https://fxpro.news