
Halliburton: ⬆️ Buy
– Halliburton reversed from support zone
– Likely to rise to resistance level 28.00
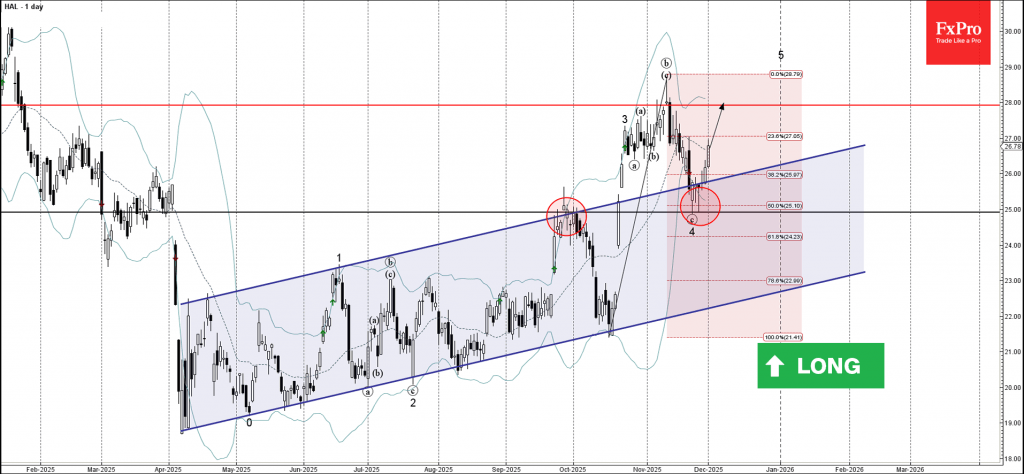
Halliburton recently reversed from the support zone between the support level 25.00 (former resistance from September), lower daily Bollinger Band and the 50% Fibonacci correction of the upward impulse from October.
The upward reversal from this support zone started the active short-term impulse wave 5.

Given the clear daily uptrend, Halliburton can be expected to rise to the next resistance level 28.00 (which stopped the previous wave b).
Source: https://fxpro.news