
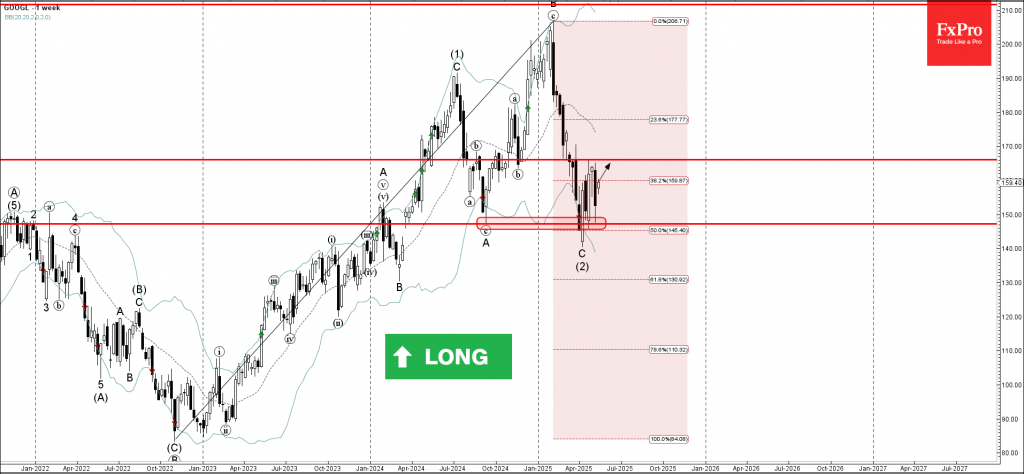
Google: ⬆️ Buy
– Google reversed from support area
– Likely to rise to resistance level 166.15
Google recently reversed up from the support area between the key support level 147.30 (which has been reversing the price from July), lower daily Bollinger Band and the 50% Fibonacci correction of the uptrend from the end of 2022.
The price previously formed the 2 weekly Japanese candlesticks reversal patterns Bullish Engulfing near the support level 147.30 – which signalled its strength.

Given the weekly uptrend, Google can be expected to rise to the next resistance level 166.15 (former support from the end of 2024).
Source: https://fxpro.news