
– Ethereum reversed from support zone
– Likely to rise to resistance level 2400.00
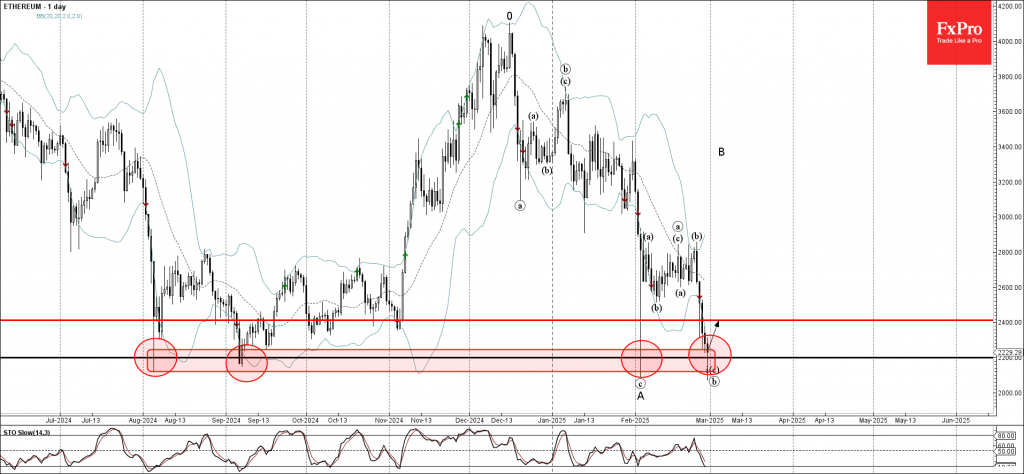
Ethereum recently reversed from the support zone between the major long-term support level 2200.00 (which has been reversing the price from August) and the lower daily Bollinger Band.
The upward reversal from this support zone is currently forming the daily Japanese candlesticks reversal pattern Hammer – a strong buy signal for Ethereum.
Given the strength of the nearby support level 2200.00 and the oversold daily Stochastic, Ethereum can be expected to rise to the next resistance level 2400.00.

Source: https://fxpro.news