Analysis & Forecast Category

– WTI crude oil reversed from support area– Likely to rise to resistance level 80.00WTI crude oil recently reversed up with the daily Hammer from the support area lying between the pivotal support level 77.00 (which has been reversing the...
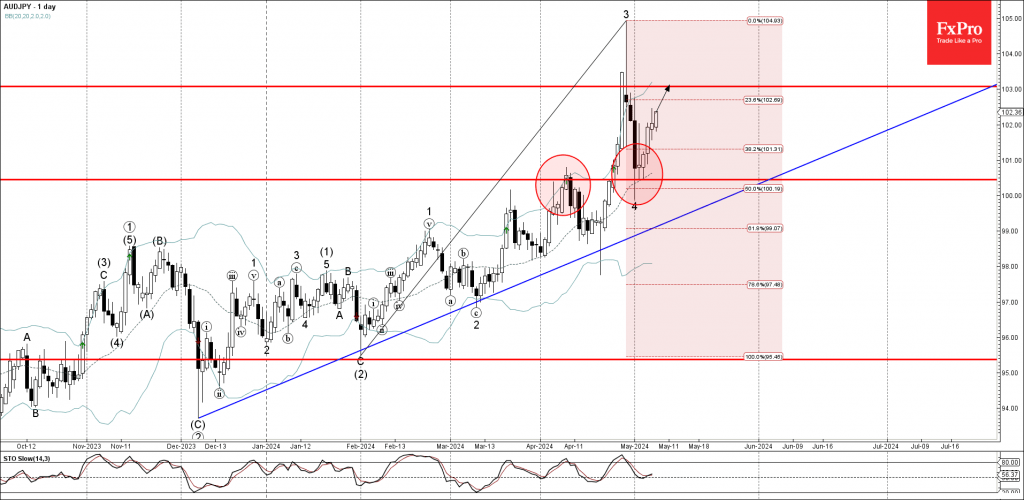
– AUDJPY reversed from support area– Likely to rise to resistance level 103.00AUDJPY currency pair recently reversed up from the support area lying between the round support level 100.45 (former strong resistance from April), 20-day movin...

– S&P 500 reversed from support level 5000.00– Likely to rise to resistance level 5300.00S&P 500 index recently reversed up from the support zone lying between the round support level 5000.00 (which also stopped the previous corre...
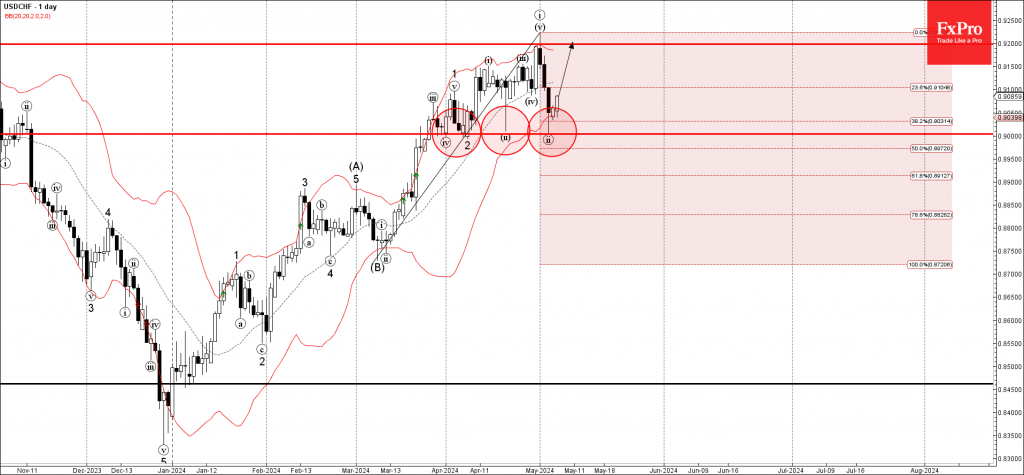
– USDCHF reversed from support zone– Likely to rise to resistance level 0.9200USDCHF currency pair recently reversed up from the support zone lying between the round support level 0.9000 (which has been reversing the price from March), lo...
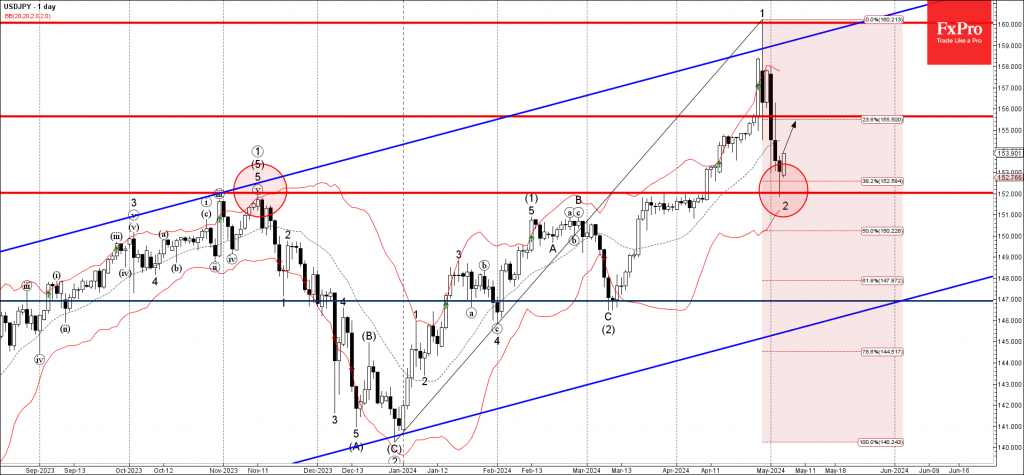
– USDJPY reversed from support zone– Likely to rise to resistance level 155.65USDJPY currency pair recently reversed up from the support zone lying between the strong support level 152.00 (former multi-month high from November) and the 38...
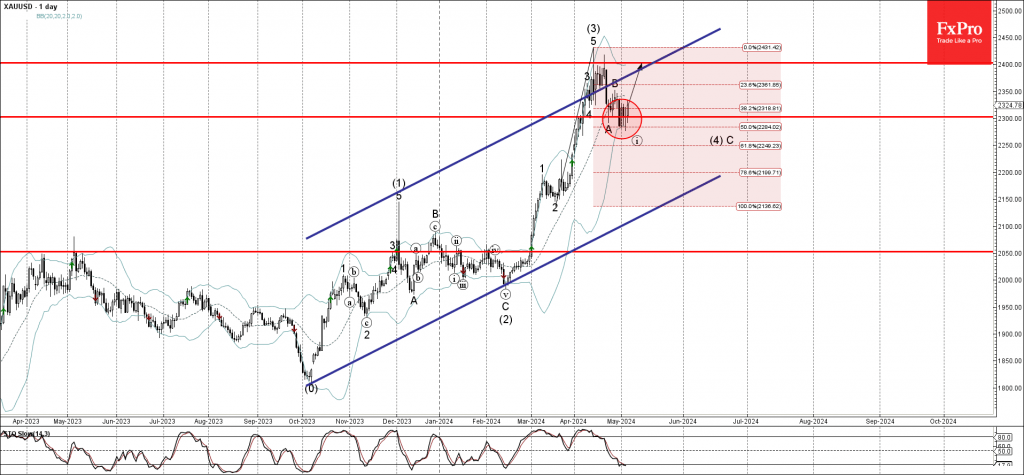
– Gold reversed from support zone– Likely to rise to resistance level 2400.00Gold recently reversed up from the support zone lying between the support level 2300.00, lower daily Bollinger Band and the 50% Fibonacci correction of the upwar...
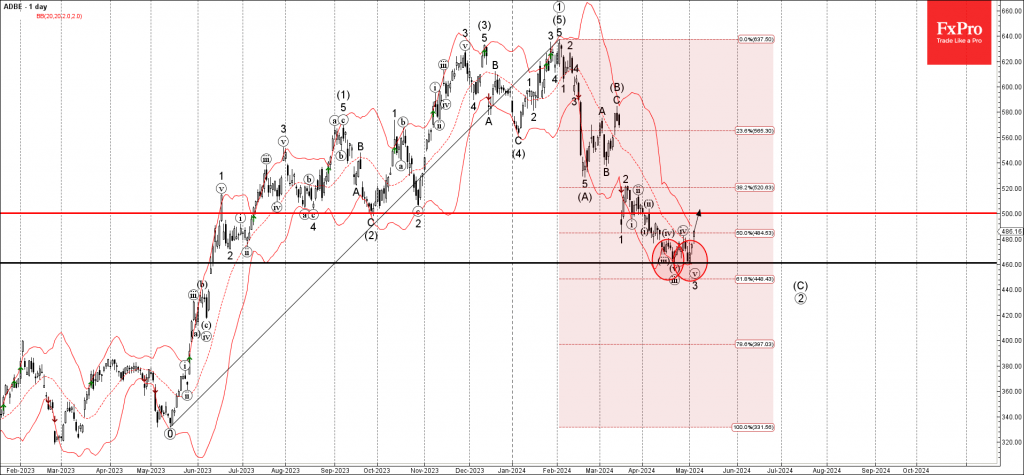
– Adobe reversed from support zone– Likely to rise to resistance level 500.00Adobe recently reversed up from the support zone lying between the support level 460.00, lower daily Bollinger Band and the 61.8% Fibonacci correction of the upt...
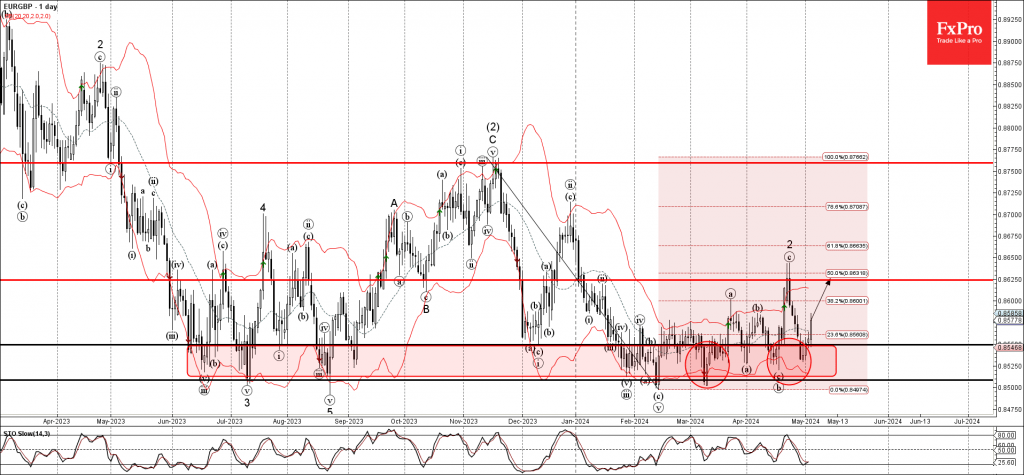
– EURGBP reversed from support zone– Likely to rise to resistance level 0.8625EURGBP recently reversed up from the support zone lying between the key support levels 0.8500, 0.8550 and the lower daily Bollinger Band.The upward reversal fro...

– EURJPY under strong bearish pressure– Likely to fall to support level 163.10EURJPY under the strong bearish pressure after the price reversed down from the major multi-year resistance level 170.00 (which started the sharp weekly downtre...
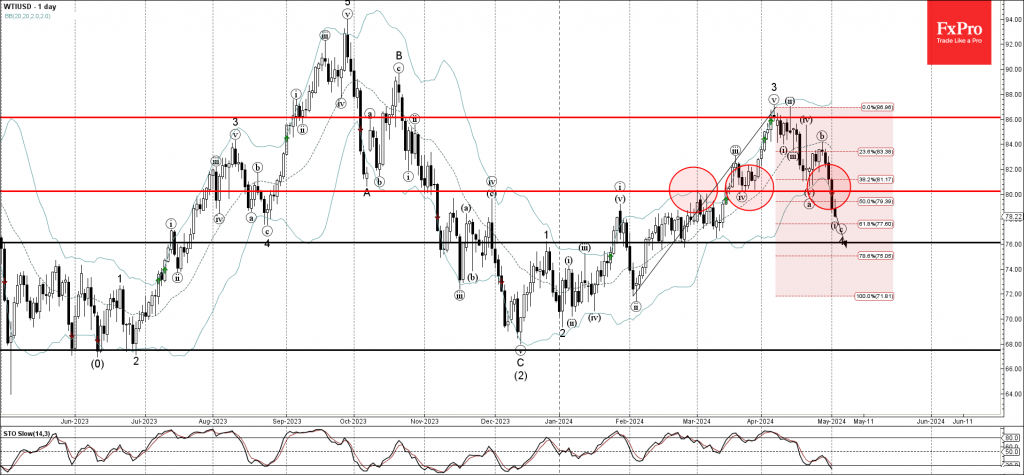
– WTI broke round support level 80.00– Likely to fall to support level 76.00WTI crude oil recently broke the round support level 80.00 (which has been reversing the price from the middle of March) standing close to the 38.2% Fibonacci cor...
