
Nasdaq-100: ⬆️ Buy
– Nasdaq-100 reversed from support zone
– Likely to rise to resistance level 24000.00
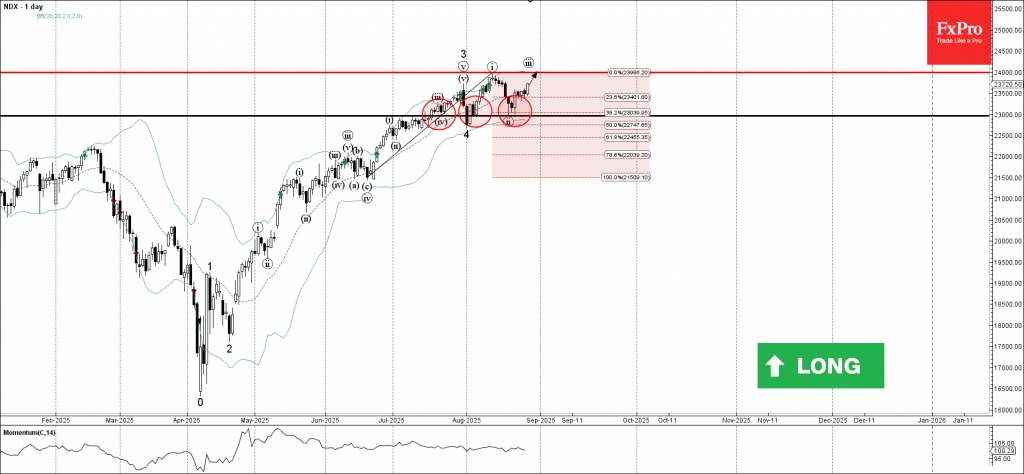
Nasdaq-100 index recently reversed from the support zone between the strong support level 23000.00 (which has been reversing the price from the middle of July), lower daily Bollinger Band and the 38.2% Fibonacci correction of the upward impulse from June.
The upward reversal from this support zone created the daily Japanese candlesticks reversal pattern Hammer – which started the active impulse wave (iii).

Given the strong daily uptrend, Nasdaq-100 index can be expected to rise to the next resistance level 24000.00 (which stopped the earlier impulse wave i).
Source: https://fxpro.news