
Exxon: ⬇️ Sell
– Exxon reversed from resistance area
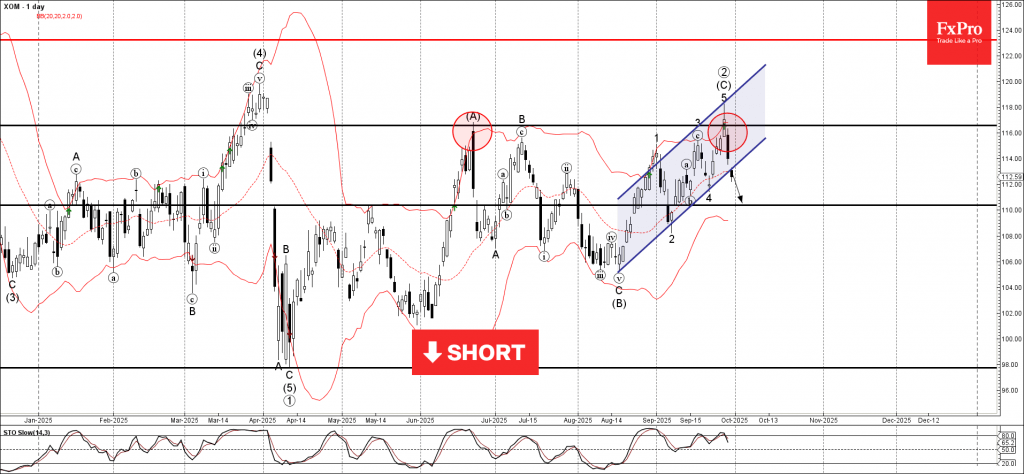
– Likely to fall to support level 110.00
Exxon recently reversed from the resistance area between the strong resistance level 116.60 (former monthly high from June), upper daily Bollinger Band and the resistance trendline of the daily up channel from August.
The downward reversal from this resistance area stopped the (C)-wave of the previous long-term ABC correction 2 from April.

Given the strength of the resistance level 116.60, Exxon can be expected to fall to the next support level 110.00.
Source: https://fxpro.news