
– AT&T broke key support level 16.60
– Likely to fall to support level 16.20
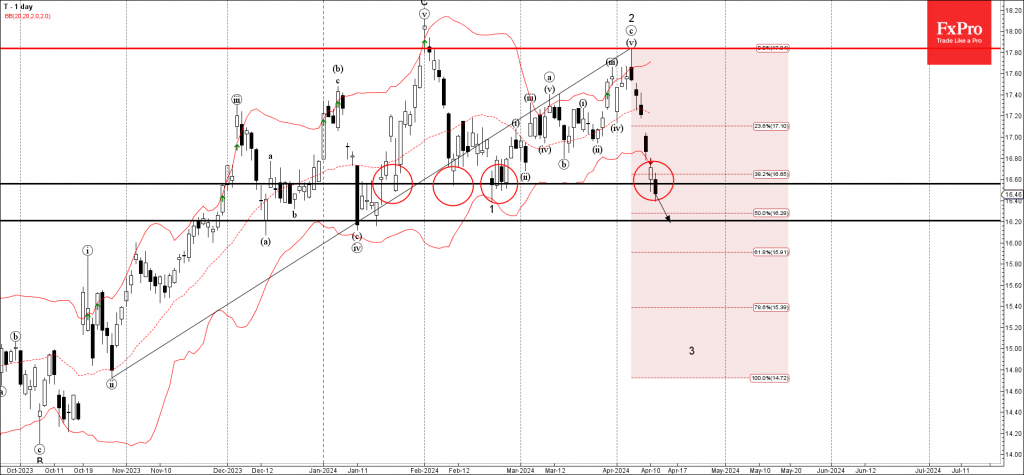
AT&T under the bearish pressure after the price broke the key support level 16.60 (which has been reversing the price from January).
The breakout of the support level 16.60 coincided with the breakout of 38.2% Fibonacci correction of the sharp upward impulse from October.
Given the strength of the active downward impulse wave 3, AT&T can be expected to fall further to the next strong support level 16.20 (former strong support from December and January).
Source: https://fxpro.news