Analysis & Forecast

Dow Jones: ⬇️ Sell– Dow Jones reversed from resistance level 49000.00– Likely to fall to support level 47525.00Dow Jones index recently reversed from the resistance area between the resistance level 49000.00 and the upper da...
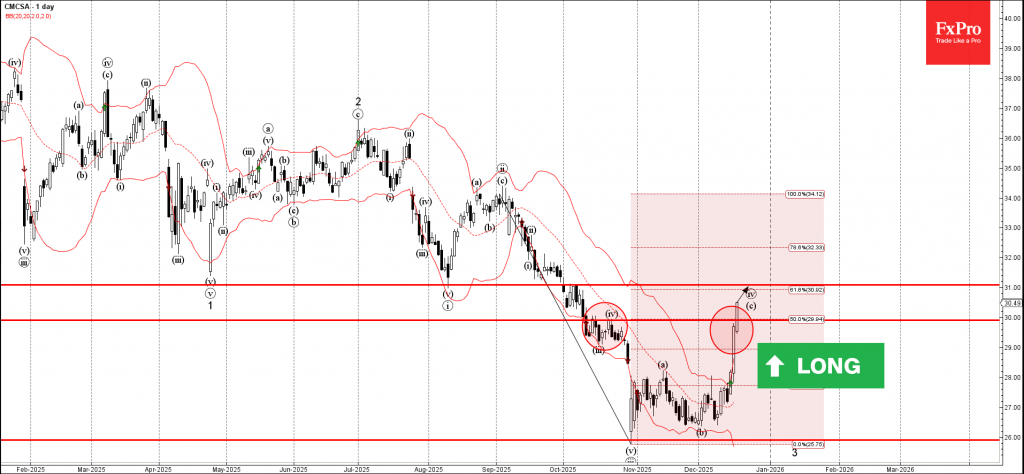
Comcast: ⬆️ Buy– Comcast broke resistance area– Likely to rise to resistance level 31.00Comcast recently broke the resistance area between the round resistance level 30.00 and 50% Fibonacci correction of the previous sharp downwa...

Platinum: ⬆️ Buy– Platinum broke resistance level 1800.00– Likely to rise to resistance level 2000.00Platinum rising inside the accelerated the impulse wave 3 which recently broke the resistance area between the resistance level 1800....
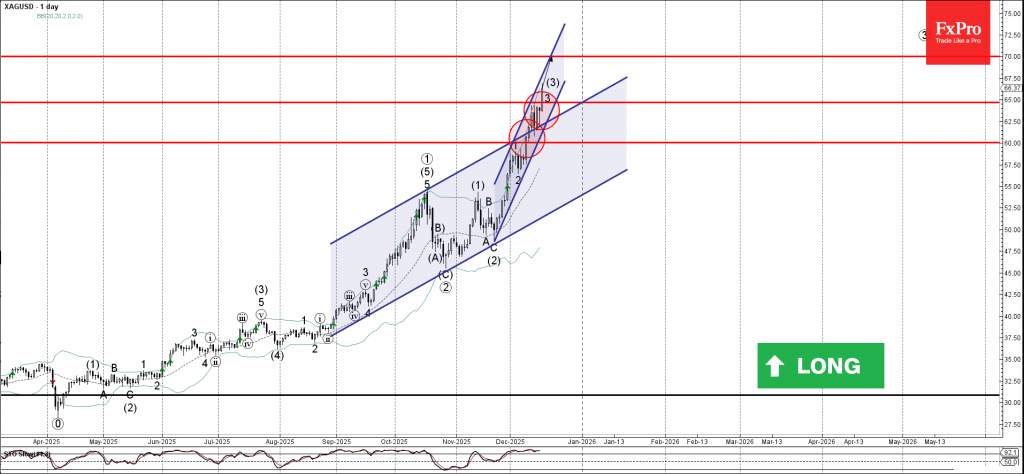
Silver: ⬆️ Buy– Silver broke resistance zone– Likely to rise to resistance level 70.00Silver recently broke the resistance zone between the resistance levels 60.00 and 65.00 as well as the resistance trendline of the daily up channel ...

Abercrombie & Fitch: ⬆️ Buy– Abercrombie & Fitch broke resistance zone– Likely to rise to resistance level 125.25Abercrombie & Fitch recently broke the resistance zone between the resistance level 103.80 (which has reverse...
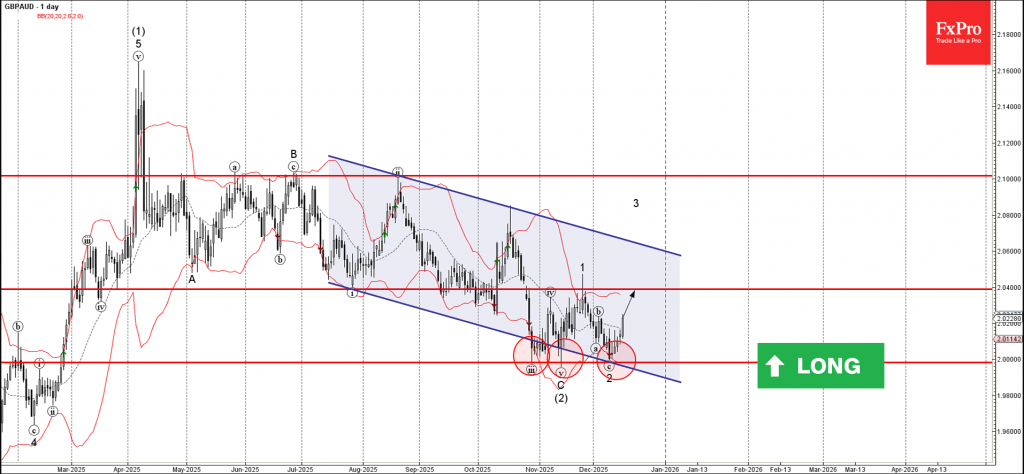
GBPAUD: ⬆️ Buy– GBPAUD reversed from support area– Likely to rise to resistance level 2.0400GBPAUD currency pair recently reversed up from the support area between the round support level 2.000 (which has been reversing the price...
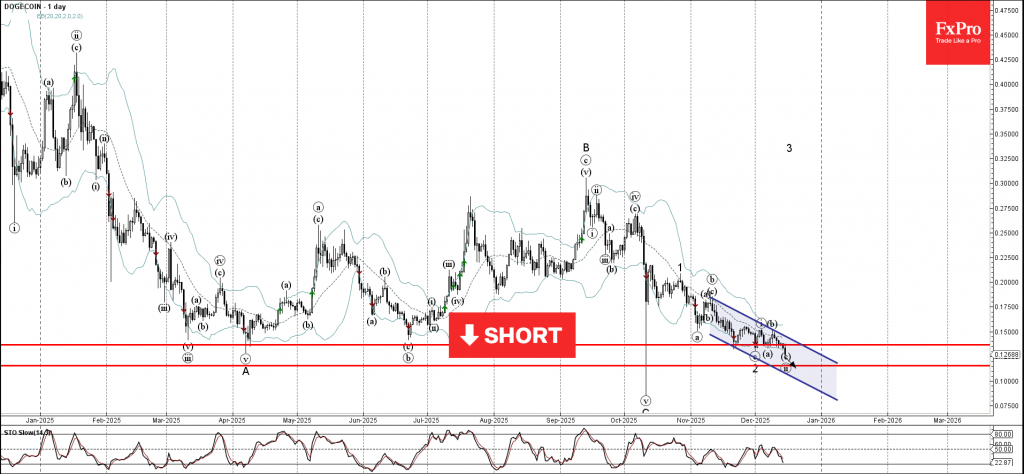
Dogecoin: ⬇️ Sell– Dogecoin broke long-term support level 0.1365– Likely to fall to support level 0.1155Dogecoin cryptocurrency recently broke below the long-term support level 0.1365 (which has been reversing the price from Apri...
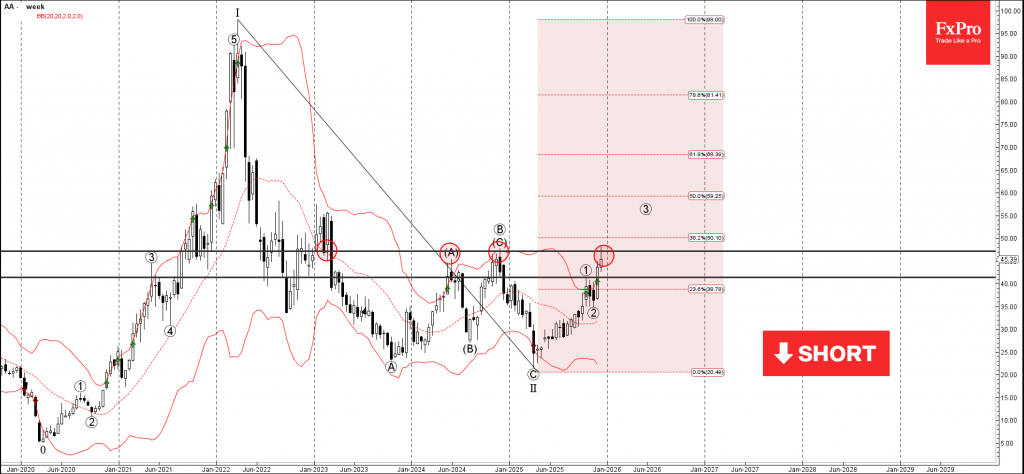
Alcoa: ⬇️ Sell– Alcoa reversed from strong resistance level 47.00– Likely to fall to support level 41.40Alcoa recently reversed down from the resistance area between the strong resistance level 47.00 (former yearly high from...

Exxon Mobil: ⬇️ Sell– Exxon Mobil reversed from resistance area– Likely to fall to support level 115.00Exxon Mobil recently reversed down from the resistance area between the key resistance level 120.00 (which has been reversing the p...
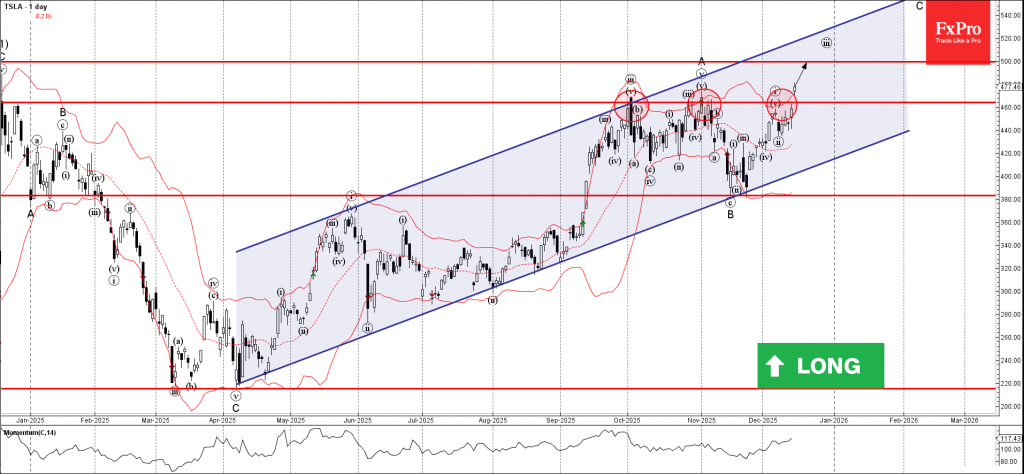
Tesla: ⬆️ Buy– Tesla broke key resistance level 460.00– Likely to rise to resistance level 500.00Tesla today opened with the sharp upward gap breaking above the key resistance level 460.00 (which has been reversing the price from...

 RoboForex
 Varlık
 FxPro
FxPro Alfa-Forex
 Libertex
 FxGlory
 XM
XM IC Piyasaları
