
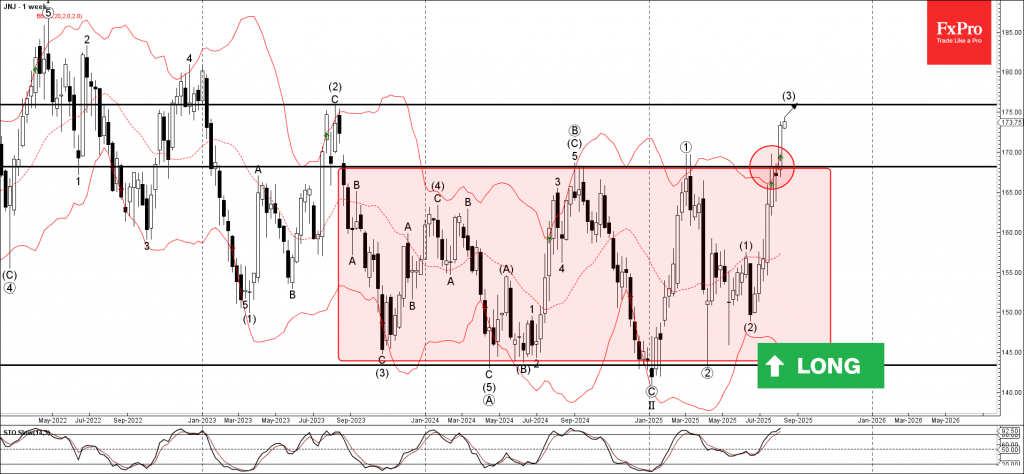
Johnson & Johnson: ⬆️ Buy
– Johnson & Johnson broke the resistance level 168.15
– Likely to rise to level 175.95
Johnson & Johnson previously broke the resistance level 168.15 (upper border of the weekly sideways price range inside which the price has been trading from 2023).
The breakout of the resistance level 168.15 accelerated the active medium-term impulse wave (3) from July.

Johnson & Johnson can be expected to rise further to the next resistance level 175.95, a former multi-month high from 2023 and the target price for the completion of the active impulse wave (3).
Source: https://fxpro.news