 Alpari
 XM
XMAnalysis & Forecast
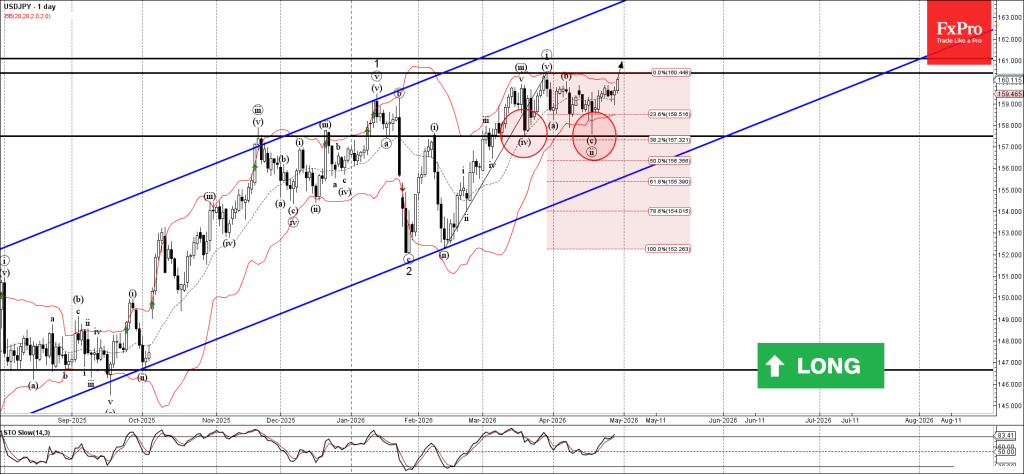
USDJPY: ⬆️ Buy – USDJPY from the support zone – Likely to test resistance levels 160.40 and 161.00 USDJPY currency pair recently reversed from the support zone between the key support level 157.50 (which stopped the previous correct...
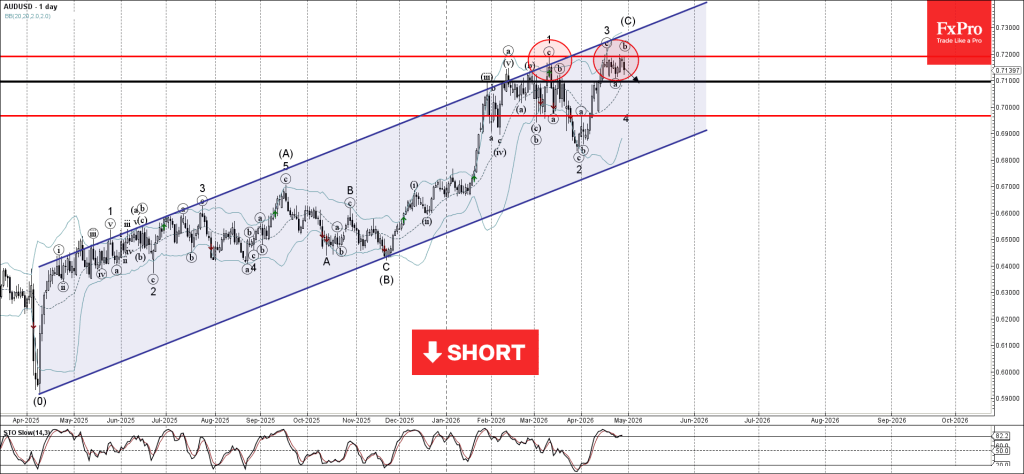
AUDUSD: ⬇️ Sell – AUDUSD reversed from key resistance level 0.7190 – Likely to fall to support level 0.7100 AUDUSD currency pair recently reversed from the resistance zone between the key resistance level 0.7190 (which has been reve...

GBPCHF: ⬆️ Buy – GBPCHF reversed from support zone – Likely to rise to resistance level 1.0500 GBPCHF recently reversed up from the support zone between strong support level 1.0400 (which stopped the daily downtrend with the daily H...

Google: ⬆️ Buy – Google reversed from key support level 296.40 – Likely to rise to resistance level 326.70 Google recently reversed up from the key support level 296.40 (former monthly low from December, which stopped earlier wave 2...

Johnson & Johnson: ⬆️ Buy – Johnson & Johnson broke resistance level 240.00 – Likely to rise to resistance level 250.00 Johnson & Johnson recently broke through the resistance level 240.00 (which has been reversing the p...

Papa John’s: ⬆️ Buy – Papa John’s reversed from long-term support level 30.60 – Likely to rise to resistance level 35.00. Papa John’s recently reversed from the strong support area between the long-term support lev...

USDCHF: ⬆️ Buy – USDCHF reversed from support area – Likely to rise to resistance level 0.7800 USDCHF currency pair recently reversed from the support area between the key support level 0.7600 (which stopped earlier impulse wave (1)...

Brent Crude oil: ⬆️ Buy – Brent Crude oil broke the resistance area – Likely to rise to resistance level 72.75 Brent Crude oil recently broke the resistance area between the round resistance level 70.00 (which has been reversing the...

WTI Crude oil: ⬆️ Buy – WTI Crude oil reversed from pivotal support level 62.00 – Likely to rise to resistance level 65.45 WTI Crude oil recently reversed from the support area between the pivotal support level 62.00 (which has been...

FTSE 100 Index: ⬆️ Buy – FTSE 100 Index broke the resistance area – Likely to rise to resistance level 10800.00 FTSE 100 Index recently broke the resistance area between the resistance level 10500.00 and the two daily up channels fr...