
– USDCAD broke the resistance zone
– Likely to rise to resistance level 1.3750
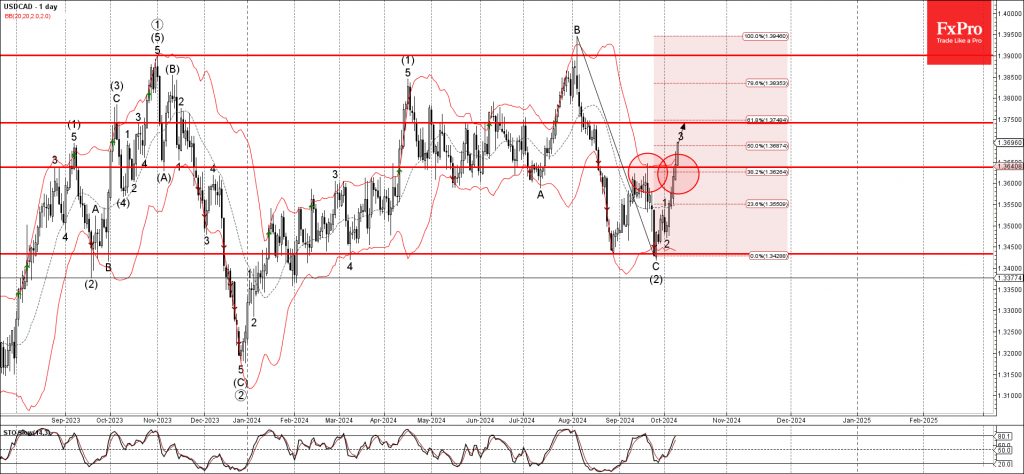
USDCAD currency pair recently broke the resistance zone located between the key resistance level 1.3635 (former monthly high from September) intersecting with the 38.2% Fibonacci correction of the downward wave C from August.
The breakout of this resistance zone strengthened the bullish pressure on this currency pair – accelerating the active impulse wave 3.
Given the strongly bullish US dollar sentiment seen today, USDCAD currency pair be expected to rise further to the next resistance level 1.3750, the target for the completion of the active impulse wave 3.

Source: https://fxpro.news