
NVDA: ⬇️ Sell
– NVDA reversed from resistance area
– Likely to fall to support level 193.75
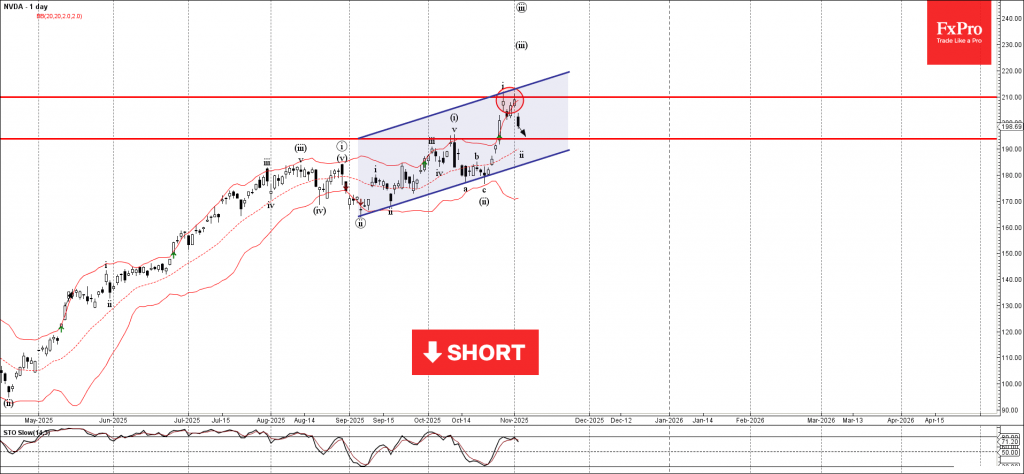
NVDA recently reversed from the resistance area between the key resistance level 210.00 (which stopped the previous impulse wave i), resistance trendline of the daily up channel from June and the upper daily Bollinger Band.
The downward reversal from this resistance area started the active short-term ABC correction ii – which belongs to wave iii from last month.

Given the strength of the resistance level 210.00 and the bearish divergence on the daily Stochastic indicator, NVDA can be expected to fall to the next support level 193.75, former resistance from the start of October.
Source: https://fxpro.news