
IBM: ⬆️ Buy
– IBM reversed from support zone
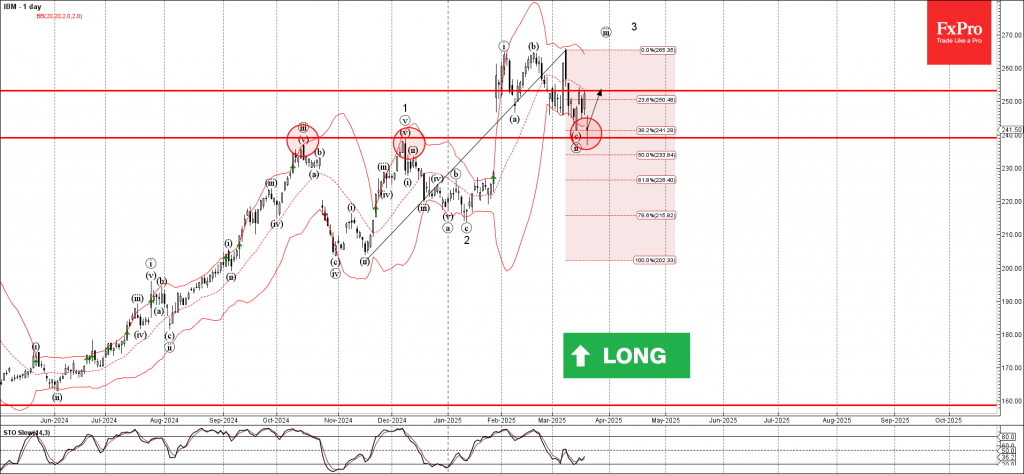
– Likely to rise to resistance level 253.00
IBM recently reversed up from the support zone between the pivotal support level 240.00 (former multi-month high from December), lower daily Bollinger Band and the 38.2% Fibonacci correction of the upward impulse from November.
The upward reversal from this support zone will likely form the daily Japanese candlesticks reversal pattern Long-legged Doji – strong buy signal for IBM.

Given the clear daily uptrend, IBM can be expected to rise to the next resistance level 253.00 (which reversed the price twice earlier this month).
Source: https://fxpro.news