
NZDUSD: ⬇️ Sell
– NZDUSD reversed from the resistance zone
– Likely to fall to support level 0.5900
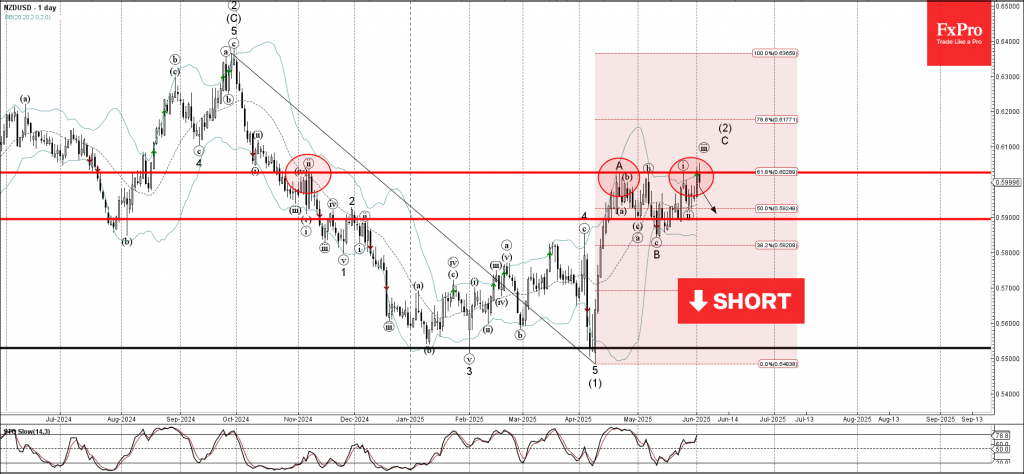
NZDUSD currency pair recently reversed down from the resistance zone between the resistance level 0.6030 (which has been reversing the price from November), the upper daily Bollinger Band and the 61.8% Fibonacci correction of the downward impulse from September.
The downward reversal from this resistance zone stopped the C-wave of the previous ABC correction (2).

Given the strength of the resistance level of 0.6030 and the bearish divergence on the daily Stochastic, the NZDUSD currency pair can be expected to fall to the next support level of 0.5900.
Source: https://fxpro.news