
IBM: ⬆️ Buy
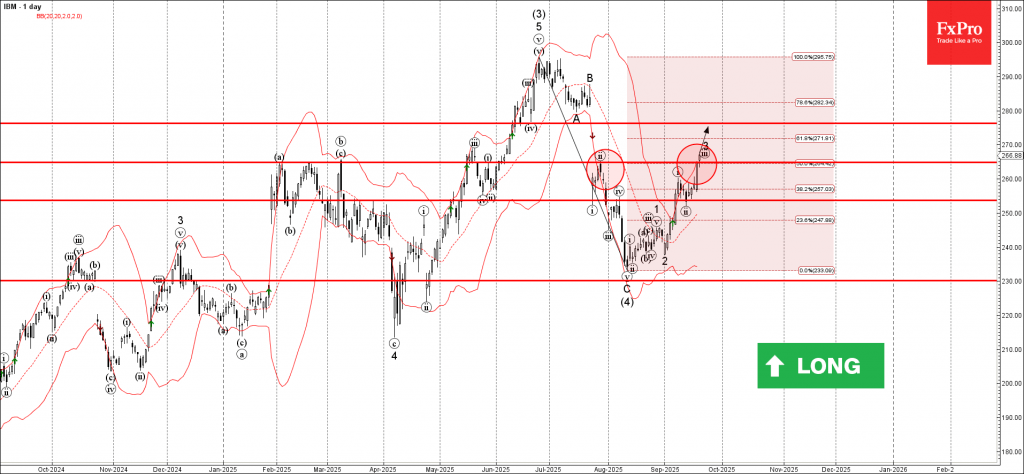
– IBM broke resistance level 264.80
– Likely to rise to resistance level 276.30
IBM recently broke the resistance zone between the resistance level 264.80 (which stopped the previous wave (ii) in July) and the 50% Fibonacci correction of the ABC correction (4) from June.
The breakout of this resistance zone continues the active short-term impulse wave 3 from the start of September.

Given the clear daily uptrend, IBM can be expected to rise to the next resistance level 276.30 (former support from June).
Source: https://fxpro.news