
– Gold reversed from resistance zone
– Likely to fall to support level 2860.00
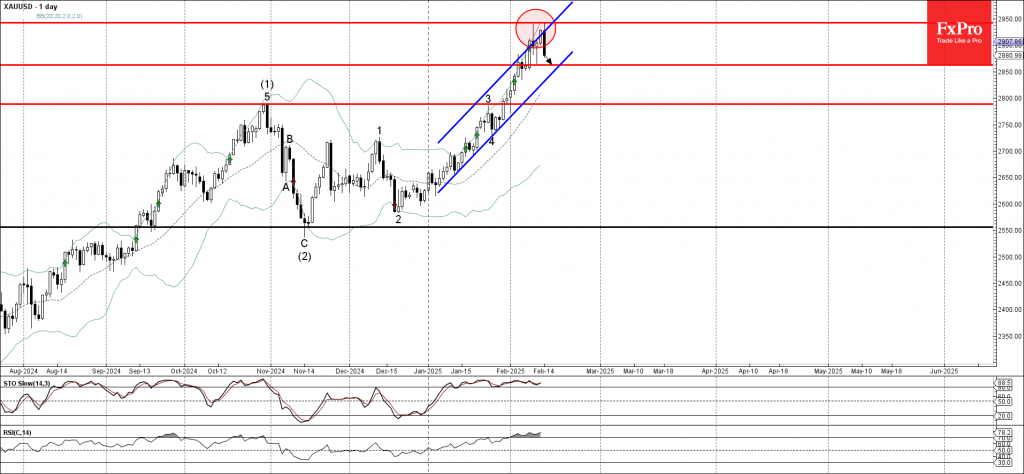
Gold today reversed down the resistance zone between the key resistance level 2940.00 (which formed daily Doji earlier this month), the resistance trendline of the daily up channel from January and the upper daily Bollinger Band.
The downward reversal from this resistance zone will most likely form the daily Japanese candlesticks reversal pattern Bearish Engulfing – if the price closes today near the current levels.
Given that both daily Stochastic and RSI indicators are high in the overbought areas, Gold can be expected to fall to the next support level 2860.00.

Source: https://fxpro.news