Analysis & Forecast
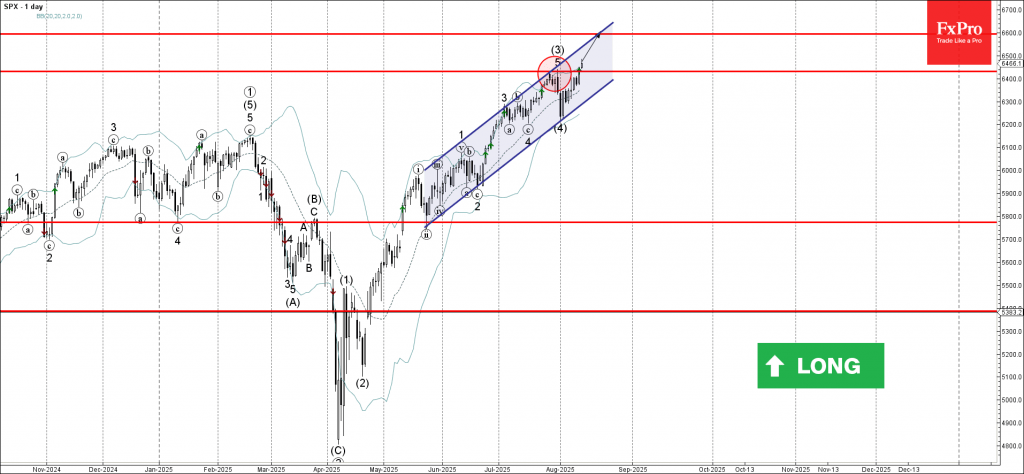
S&P 500: ⬆️ Buy– S&P 500 broke key resistance level 6435.00– Likely to rise to resistance level 6600.00S&P 500 index recently broke above the key resistance level 6435.00, which stopped the previous intermediate impulse wa...
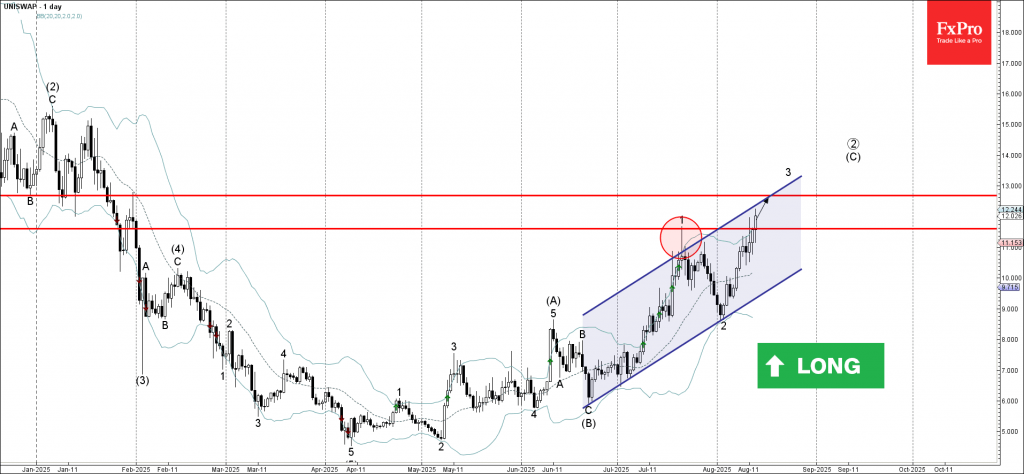
Uniswap: ⬆️ Buy– Uniswap under bullish pressure– Likely to rise to resistance level 13.00Uniswap cryptocurrency is under the bullish pressure after the earlier breakout of the resistance level 11.60 (which stopped wave 1 at the end of...
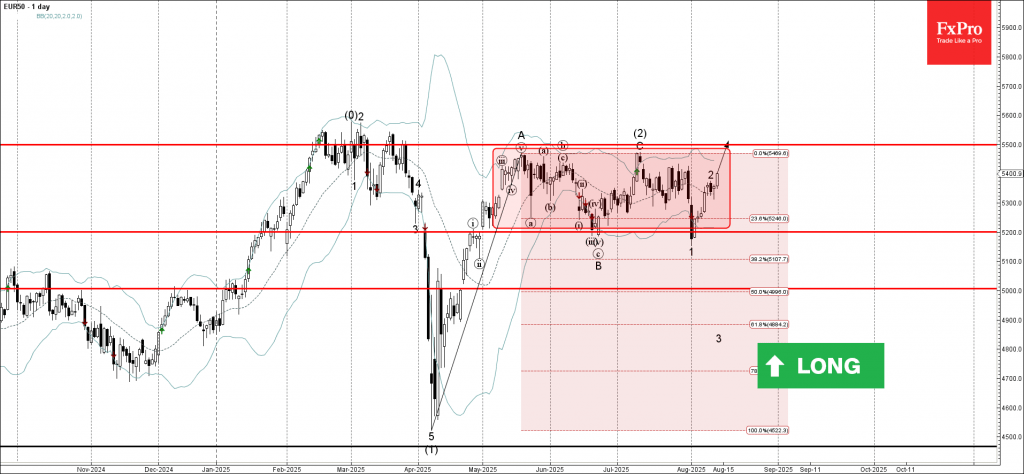
EUR50: ⬆️ Buy– EUR50 rising inside sideways price– Likely to reach resistance 5200.00EUR50 index continues to rise inside the sideways price range set between price levels 5200.00 and 5500.00 – which have been reversing the price fr...
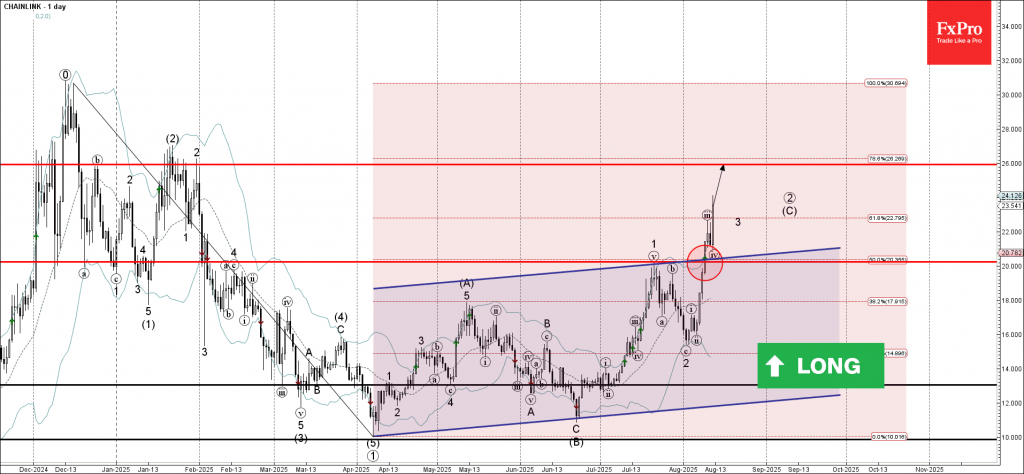
Chainlink: ⬆️ Buy– Chainlink broke the resistance zone– Likely to rise to resistance level 26.00Chainlink cryptocurrency recently broke the resistance zone between the round resistance level 20.00, the resistance trendline of the dail...
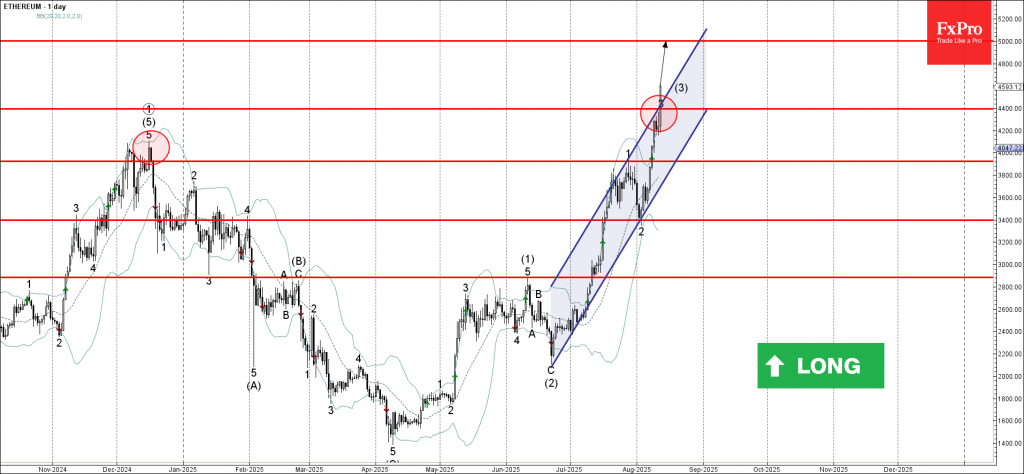
Ethereum: ⬆️ Buy– Ethereum rising inside impulse wave (3)– Likely to rise to resistance level 5000.00Ethereum continues to rise inside the sharp upward impulse wave (3), which previously broke the resistance zone between the resistanc...
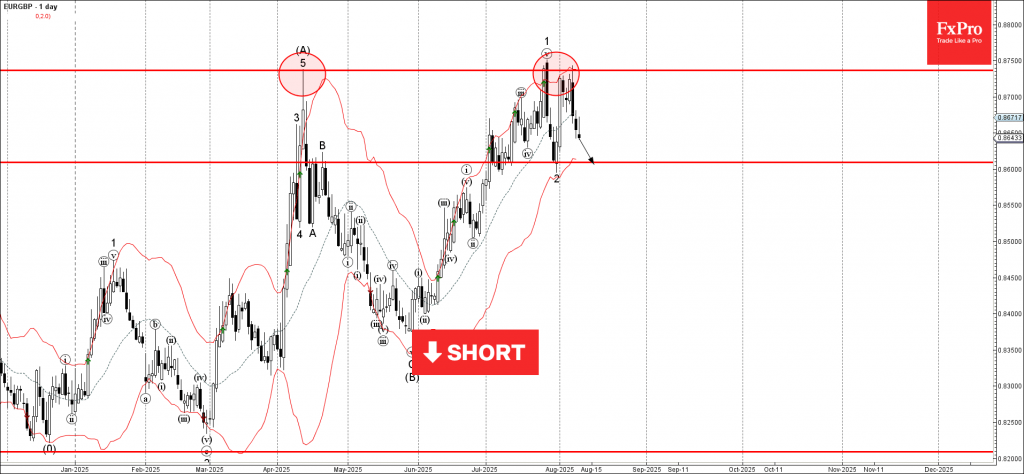
EURGBP: ⬇️ Sell– EURGBP reversed from a strong resistance level 0.8735– Likely to fall to support level 0.8600EURGBP currency pair recently reversed down from the strong resistance level 0.8735 (which stopped all earlier sharp impulse...
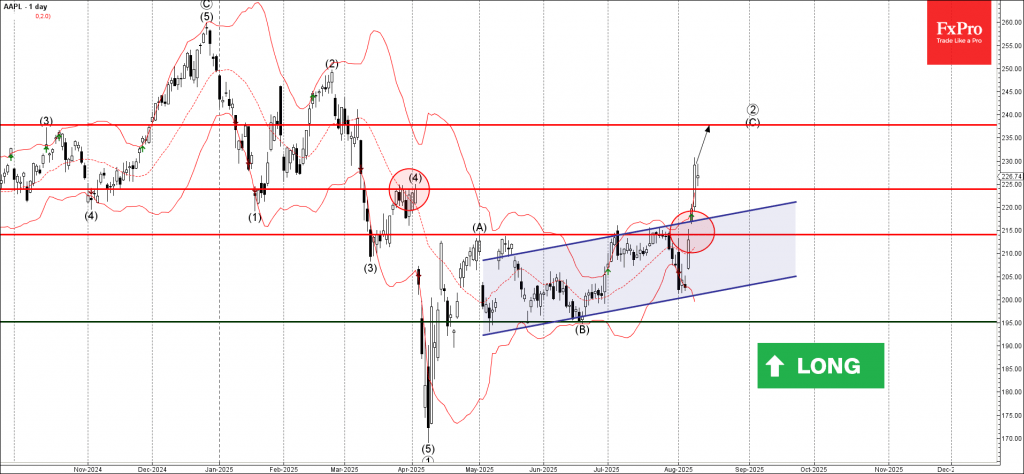
Apple: ⬆️ Buy– Apple broke resistance level 225.00– Likely to rise to resistance level 237.70Apple recently broke the resistance level 225.00 (which stopped wave (4) in April) – which was proceeded by the breakout of the strong resi...
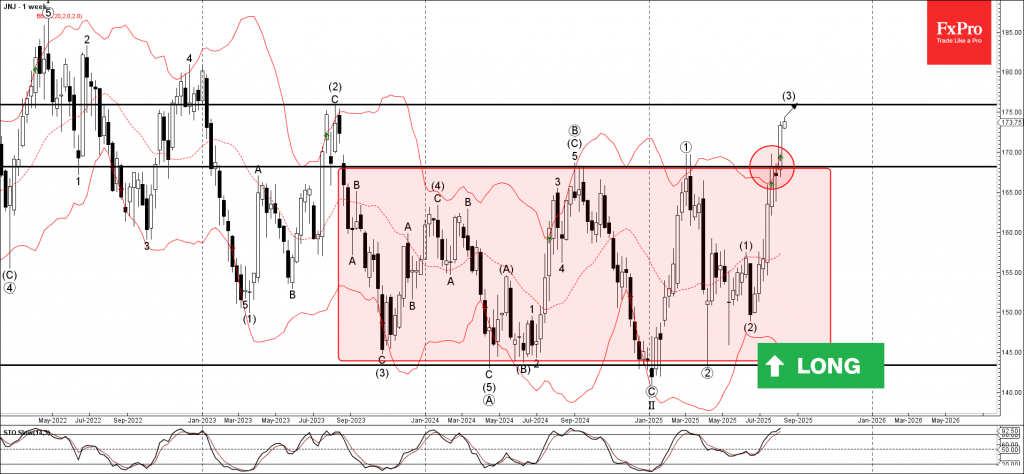
Johnson & Johnson: ⬆️ Buy– Johnson & Johnson broke the resistance level 168.15– Likely to rise to level 175.95Johnson & Johnson previously broke the resistance level 168.15 (upper border of the weekly sideways price range ...
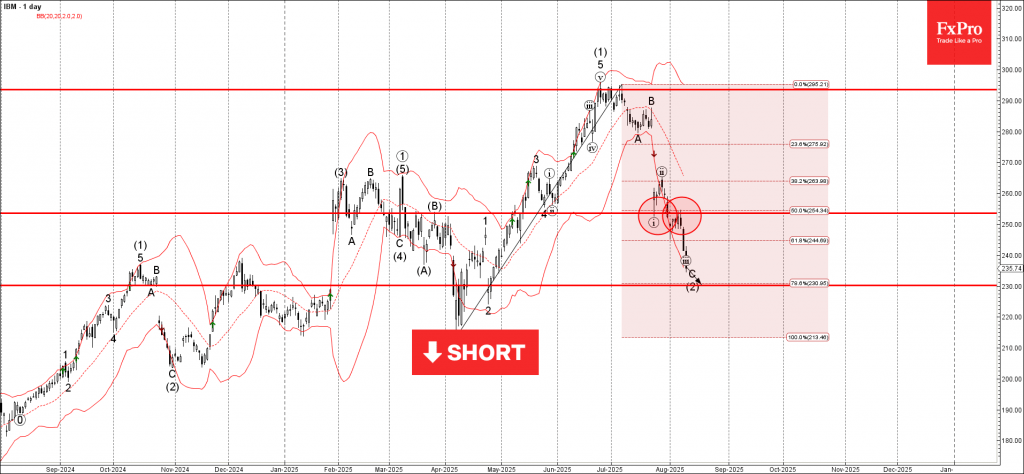
IBM: ⬇️ Sell– IBM reversed from resistance level 253.60– Likely to fall to support level 230.00IBM recently reversed from the resistance level 253.60 (former support from the start of July) and the 50% Fibonacci correction of the upwa...
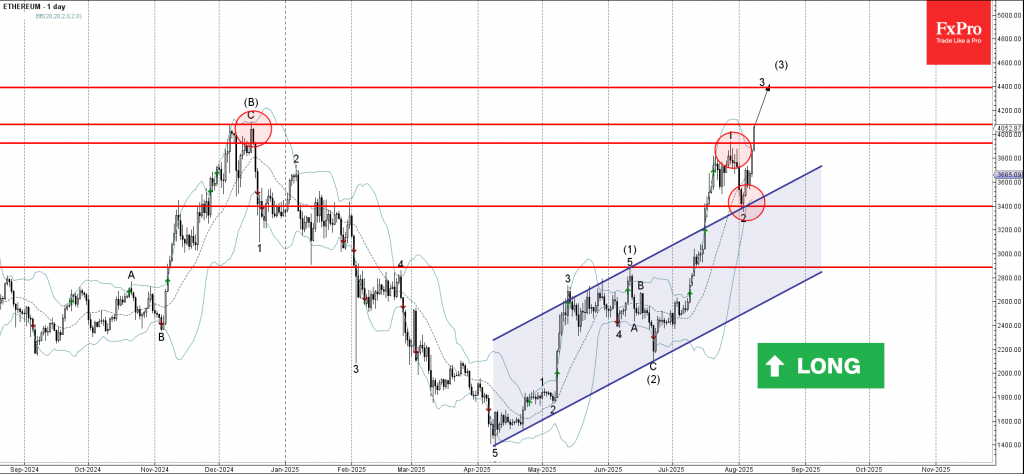
Ethereum: ⬆️ Buy– Ethereum broke the resistance level 3925.00– Likely to rise to resistance level 4108.00Ethereum cryptocurrency recently broke the resistance level 3925.00 (which stopped the previous impulse wave 1 at the end of July...

 RoboForex
 Exness
 FxPro
FxPro Alfa-Forex
 Libertex
 FxGlory
 XM
XM IC Markets
 Forex.com
 AXITrader