
NVDA: ⬆️ Buy
– NVDA reversed from support zone
– Likely to rise to resistance level 194.30
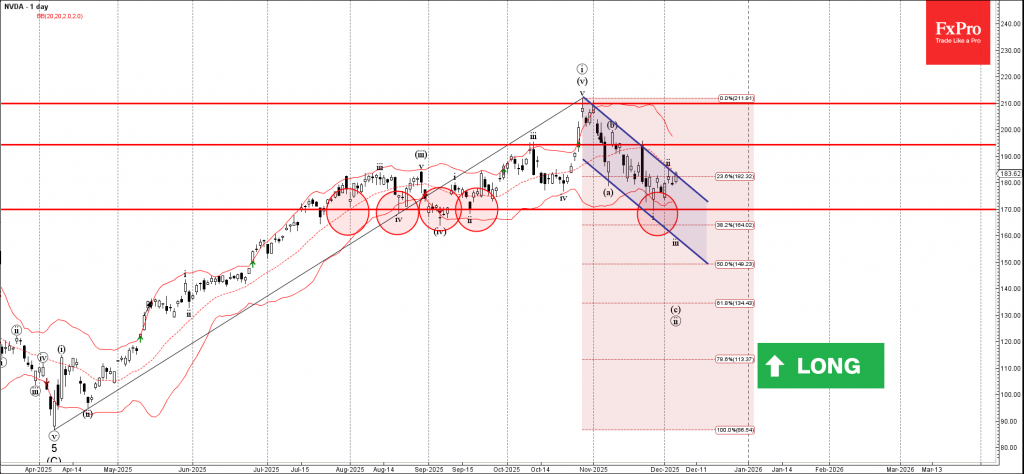
NVDA recently reversed with the daily Hammer from the support zone between the multi-month support level 170.00 (which has been reversing the price from August), lower daily Bollinger Band and the support trendline of the daily down channel from October.
NVDA just broke the aforementioned down channel from October – which is lily to strengthen the bullish pressure on NVDA .

Given the clear daily uptrend, NVDA can be expected to rise to the next resistance level 194.30 (which reversed the price at the end of November).
Source: https://fxpro.news