
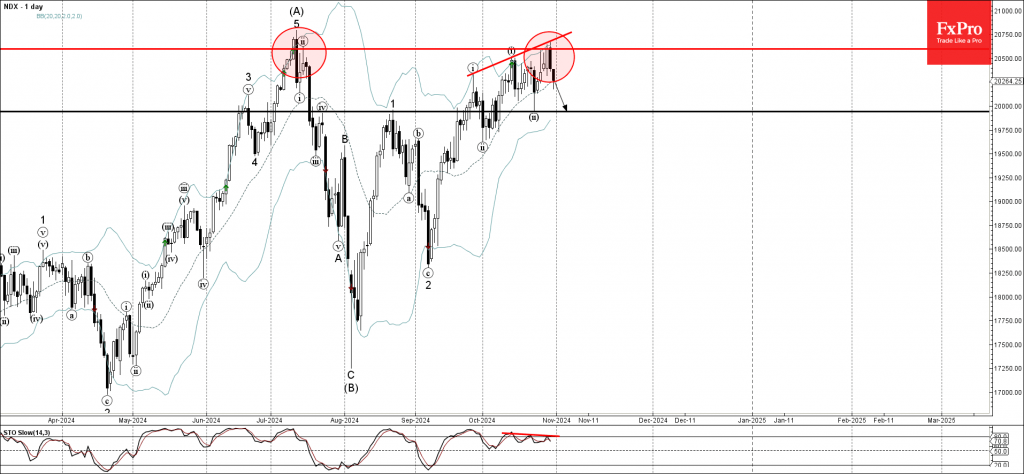
- Nasdaq-100 reversed from resistance level 20600.00
- Likely to fall to support level 20000.00
Nasdaq-100 index recently reversed down from the major resistance level 20600.00 (which stopped the previous sharp upward impulse wave (A) at the start of July), strengthened by the upper daily Bollinger Band.
The downward reversal from the resistance level 20600.00 created the daily Japanese candlesticks reversal pattern Bearish Engulfing.
Given the strength of the resistance level 20600.00 and the triple bearish divergence on the daily Stochastic indicator, the Nasdaq-100 index can be expected to fall further to the next round support level 20000.00 (which stopped the earlier wave ii).

Source: https://fxpro.news