Analysis & Forecast

Sony: ⬇️ Sell – Sony broke long-term support level 24.00 – Likely to fall to support level 22.00 Sony reopened today with the sharp downward gap – after the price broke below the strong long-term support level 24.00 (former monthl...

Nikkei 225: ⬆️ Buy – Nikkei 225 reversed from pivotal support level 52000.00 – Likely to rise to resistance level 54750.00 Nikkei 225 index recently reversed from the support zone between the pivotal support level 52000.00 (former r...

Starbucks: ⬇️ Sell – Starbucks reversed from resistance zone – Likely to fall to support level 92.50 Starbucks recently reversed down from the resistance zone between the strong resistance level 96.60 (former strong resistance ...

EURJPY: ⬆️ Buy – EURJPY broke resistance level 185.30 – Likely to rise to resistance level 188.00 EURJPY currency pair recently broke above the resistance level 185.30 (which is the upper border of the sideways price range inside wh...

USDJPY: ⬆️ Buy USDJPY reversed from support area Likely to rise to resistance level 5.50 USDJPY currency pair recently reversed up from the support area between the support level 157.75 (former strong resistance from November and October) and...

Uniswap: ⬆️ Buy – Uniswap reversed from support area – Likely to rise to resistance level 5.50 Uniswap cryptocurrency recently reversed up from the support area between the support level 4.715 (which has been reversing the...

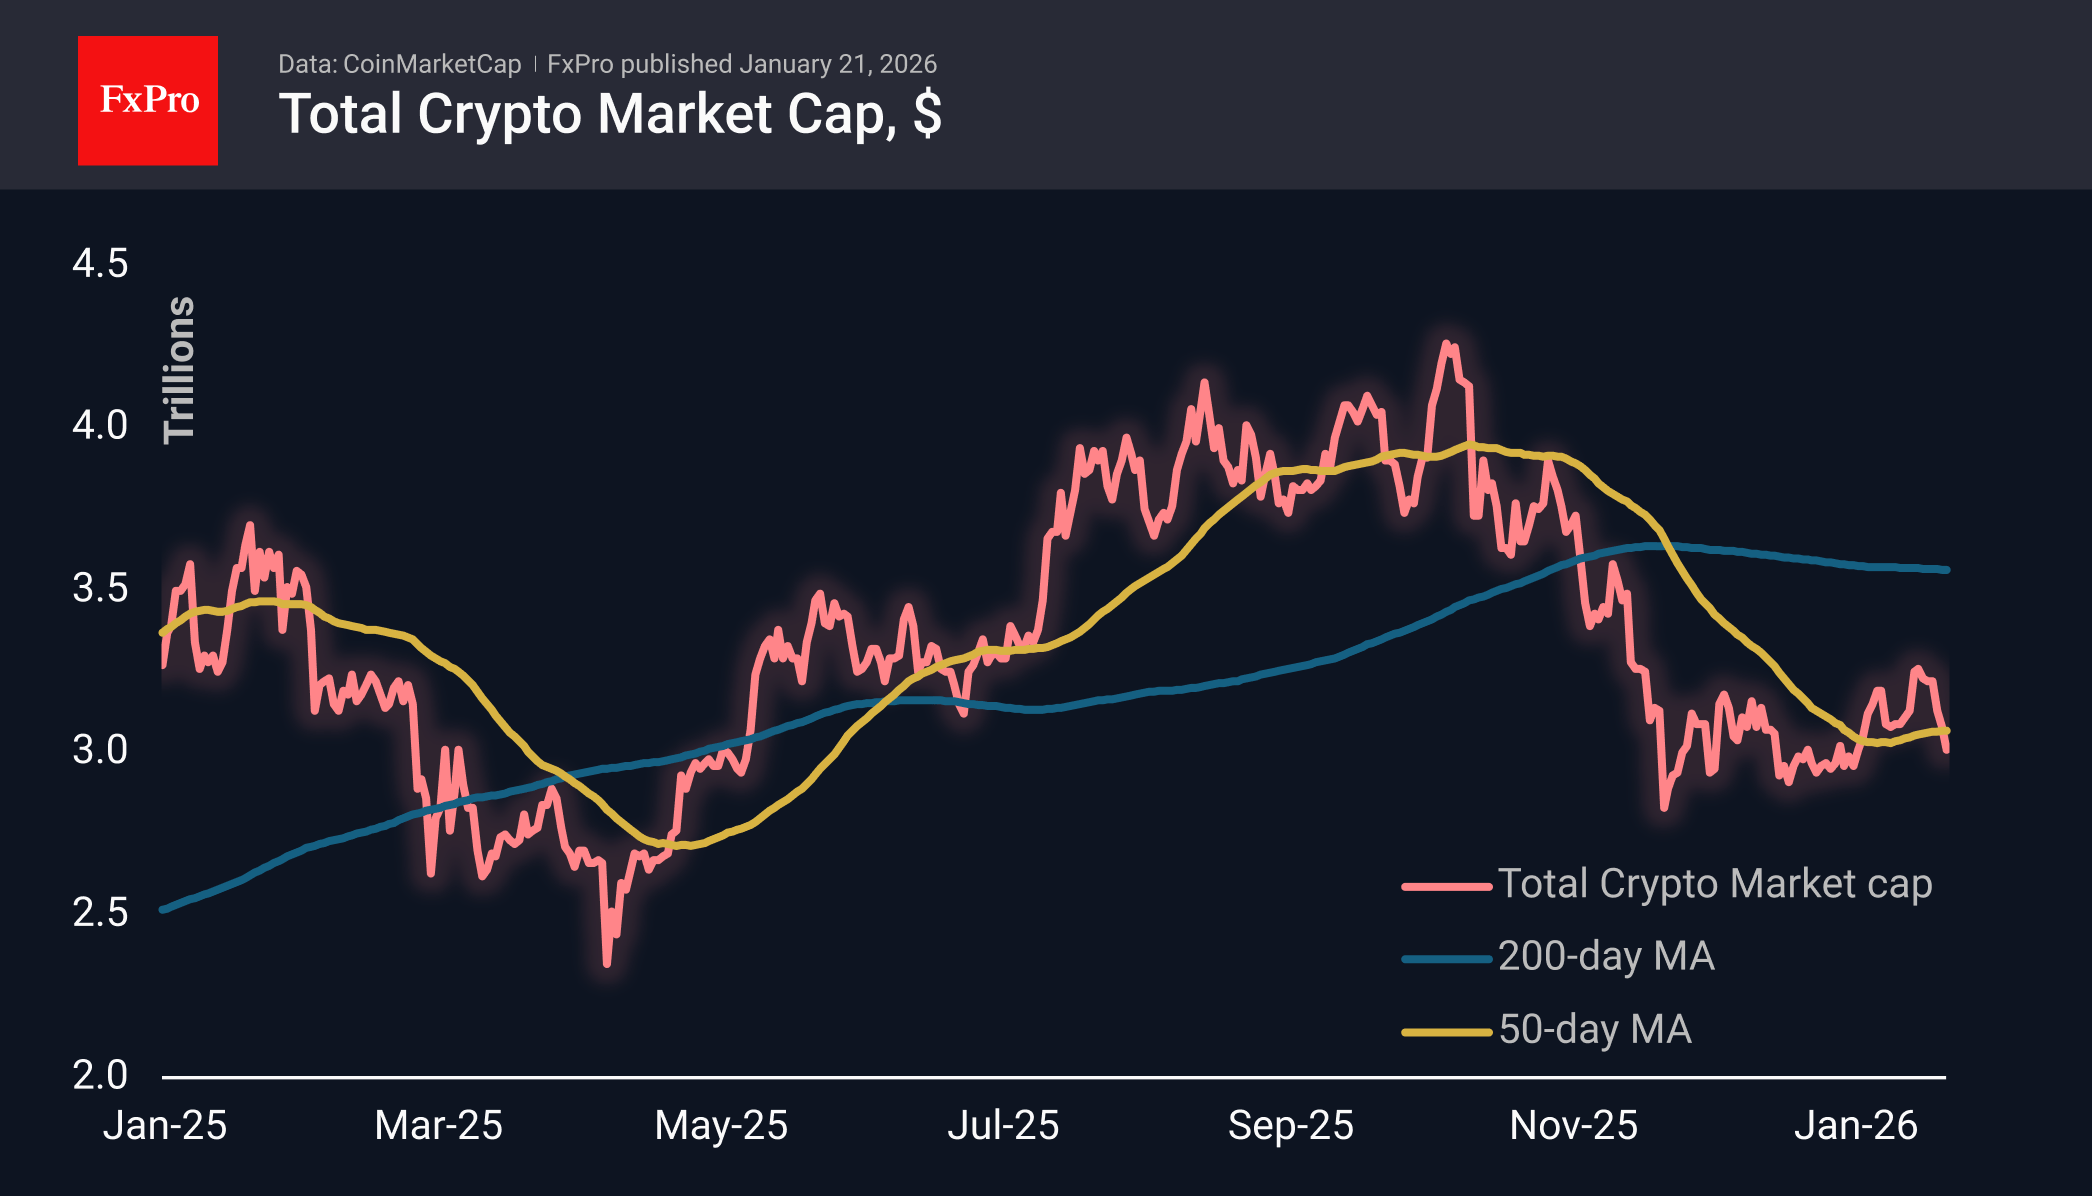
Market Overview The crypto market capitalisation fell below $3T, slightly exceeding this round level at the start of active trading in Europe, but losing more than 2% in 24 hours. The market is once again below the 50-day moving average, and the gro...

EUR50 Index: ⬇️ Sell – EUR50 Index reversed from resistance area – Likely to fall to support level 5900.00 EUR50 Index recently reversed from the resistance area between the resistance level 6040.00, upper daily Bollinger ...

Gold: ⬆️ Buy – Gold reversed from key support level 4547.00 – Likely to rise to resistance level 4800.00 Gold recently reversed up from the key support level 4547.00 (former resistance from the end of December, acting as s...

EURJPY: ⬆️ Buy – EURJPY reversed from support zone – Likely to rise to resistance level 185.30 EURJPY currency pair recently down from the support zone between the support level 182.70 (low of the previous minor correction...

 RoboForex
 Exness
 FxPro
FxPro Alfa-Forex
 Libertex
 FxGlory
 XM
XM Mercati dei circuiti integrati
