
Microsoft: ⬇️ Sell
– Microsoft reversed from resistance zone
– Likely to fall to support level 447.00
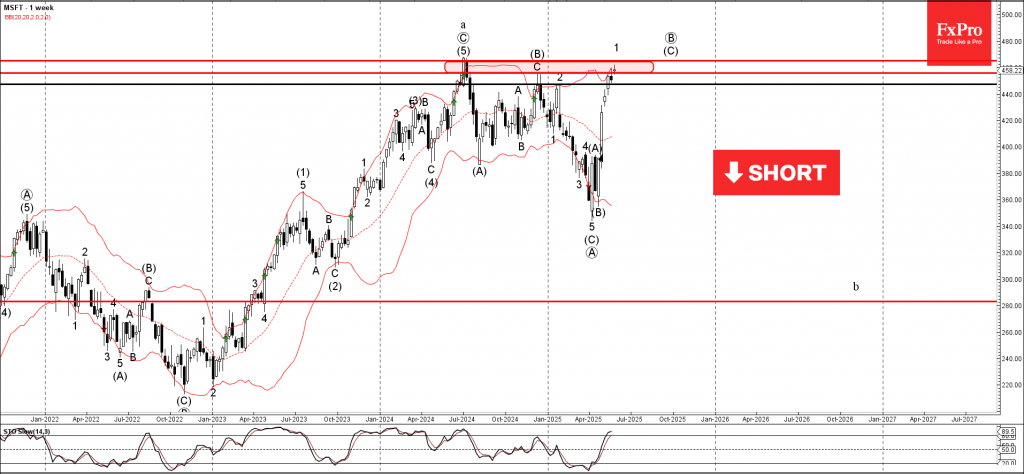
Microsoft recently reversed down from the resistance zone located between the resistance levels 465.00 (which stopped the weekly uptrend in 2024) and 455.00 (top of wave (B) from the end of 2024).
This resistance zone was further strengthened by the upper weekly and daily Bollinger Bands.

Given the strength of the aforementioned resistance zone and the overbought daily Stochastic, Microsoft can be expected to fall to the next support level 447.00.
Source: https://fxpro.news