Long-term trends generate the most profits, and everyone knows this. The problem is that you can’t always get in on the trend at the beginning, but that doesn’t mean you still can’t make the best out of the remaining trend. To do so, we’re going to look at the pullback trading strategy, which can help you enter a long-term trend even if you missed the beginning.
What are pullbacks?
In any market, trends do not occur in a continuous pattern, but rather in a series of up and down motions. These seeming reversals in the trend that are followed by the trend continuing are what we call pullbacks. Think of it as pulling back the trigger before the bullet flies in the other direction.
Trading the pullback strategy
Now let’s get into it, How exactly does the pullback trading strategy work? Well, there are a few steps you will need to follow if you’re going to be effective.
Determine whether there is a trend
The main problem people face when using this strategy is failing to distinguish a trending market from one that is moving sideways. If the markets are moving sideways, this strategy will not work and you will just end up being stopped.
There are 3 ways to confirm if the market is trending, the first through observing price action patterns. A trending market will form higher highs and higher lows in an uptrend, or lower highs and lower lows in a downtrend. Below is an illustration of a trending market:
Even with a glance, you can see that the markets kept forming higher highs and higher lows throughout the trend. Furthermore, you know that the trend is broken when the final peak is not followed by a lower low. This is a trending market.
The second method of confirming the trend is by drawing the support and resistance levels. In the image above, the S/R levels would appear like so:
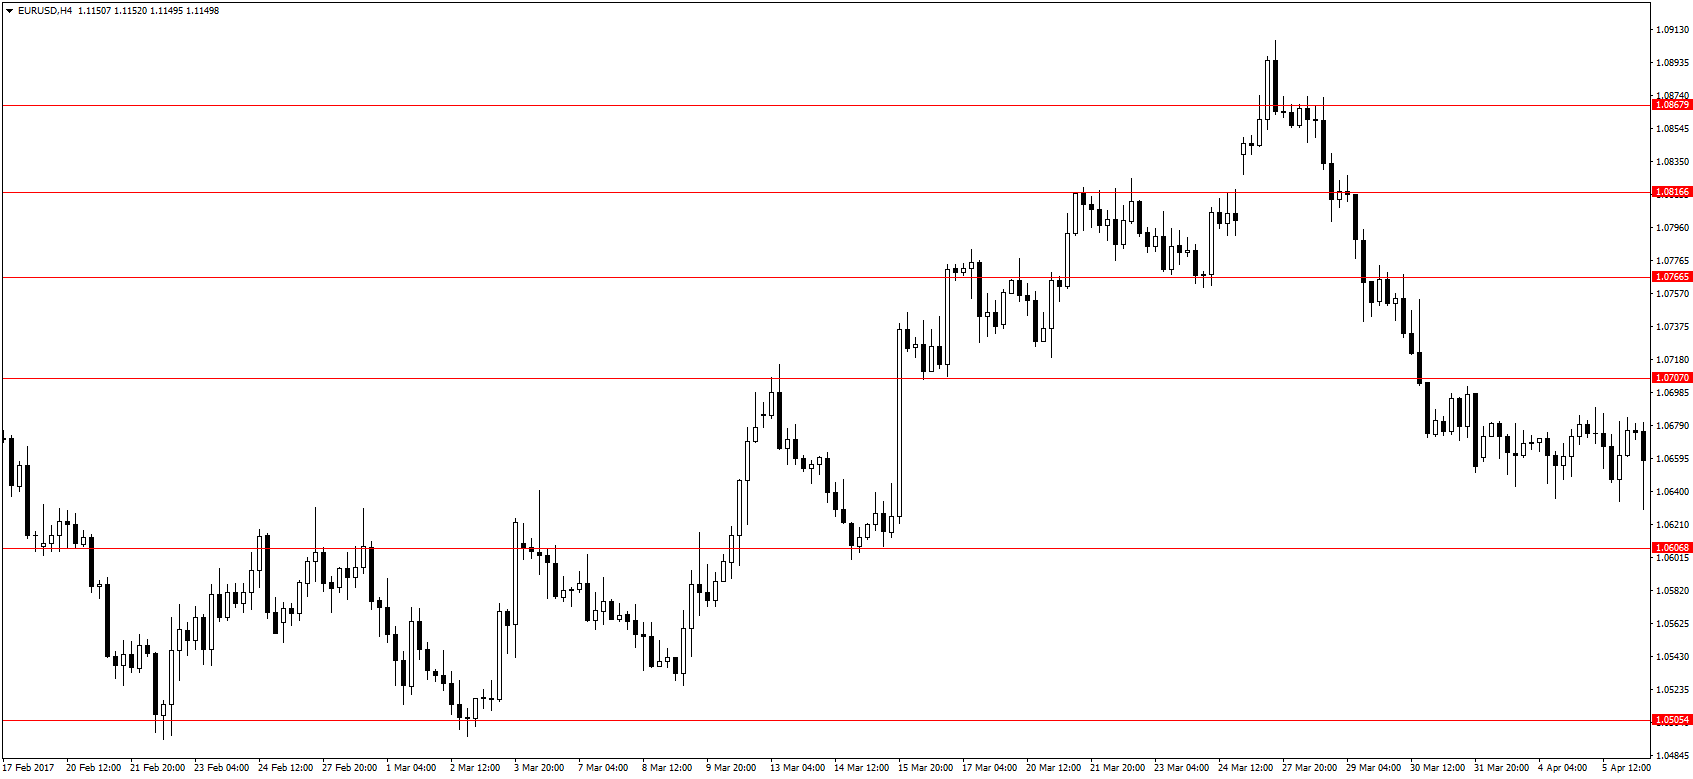
In a trending market, S/R levels are constantly being broken through and turned. For example, once a resistance level is broken, it will then become the support that propels prices higher. (Breakout trading strategies)
If it were a ranging/sideways market, then prices would bounce off these S/R levels and remain within the limits like so:
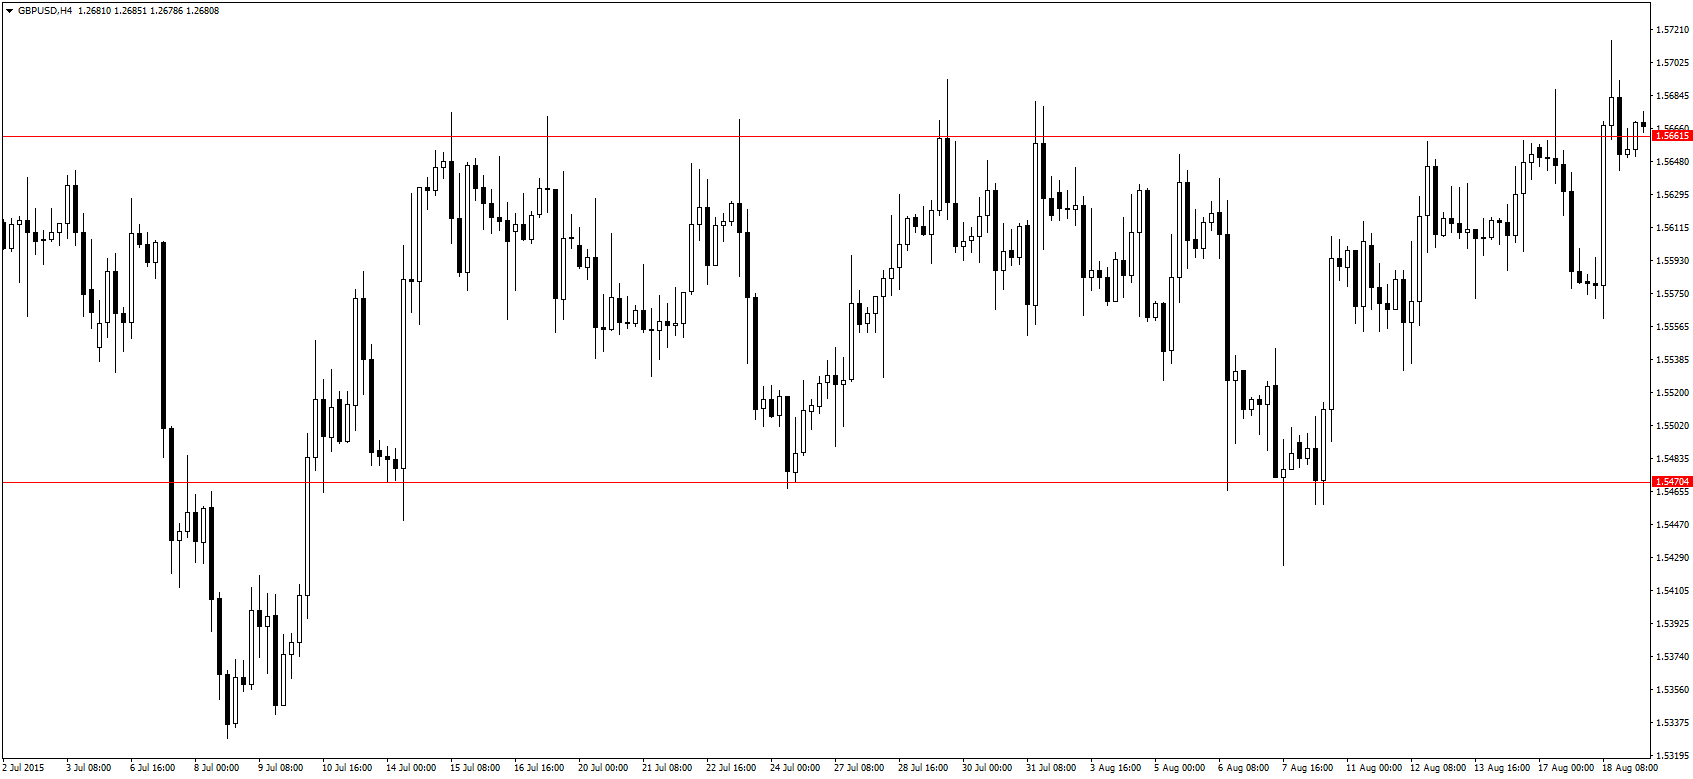
Here, the prices remained within the S/R levels, showing that this was a ranging market and not a trend.
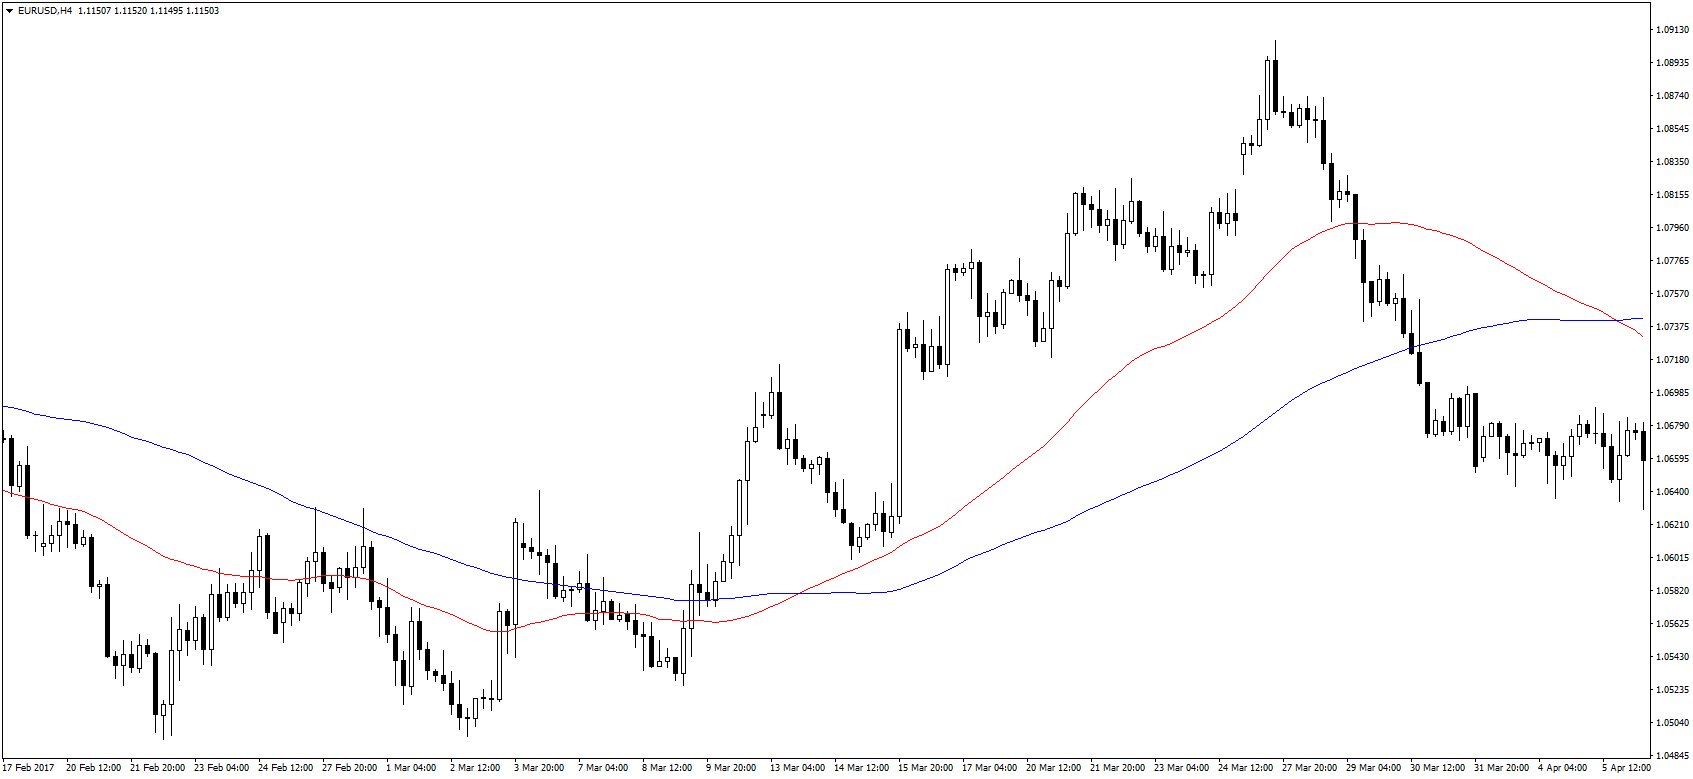
Finally, and easiest of all, add moving averages to confirm if prices remain consistently on one side of the moving averages. In our trending market, the prices remained above the 50 and 100-period moving averages throughout the trend. (Forex strategy based on MAs)
With these 3 steps, you can now determine whether you’re dealing with a trend or not. If these conditions are not met, move on to the next Forex charts and don’t try to force the strategy. The best Forex brokers will offer over 100 trading instruments, and all of them can benefit from the pullback trading strategy.
Determine the extent of the pullback
Here is the trickiest part, When do you enter the trade in a trend if you don’t know how much of a pullback to expect? To determine when you should enter a position, it’s going to depend on whether you’re sitting at your trading station or not. For those who will be at their trading station, there are 2 ways to know where the pullback might reach. The first is through the observation of moving averages. As mentioned before, when a market is trending, it will remain on one side of the moving averages.
When you observe market prices pulling back toward the moving averages, get ready to enter the position. In the image above, you can see how prices were seemingly repelled by the 50-period moving average, momentarily touching it or getting close before resuming the uptrend. If you have the time to sit and wait, you can enter a trade in the trend’s direction when you see prices approaching the moving averages.
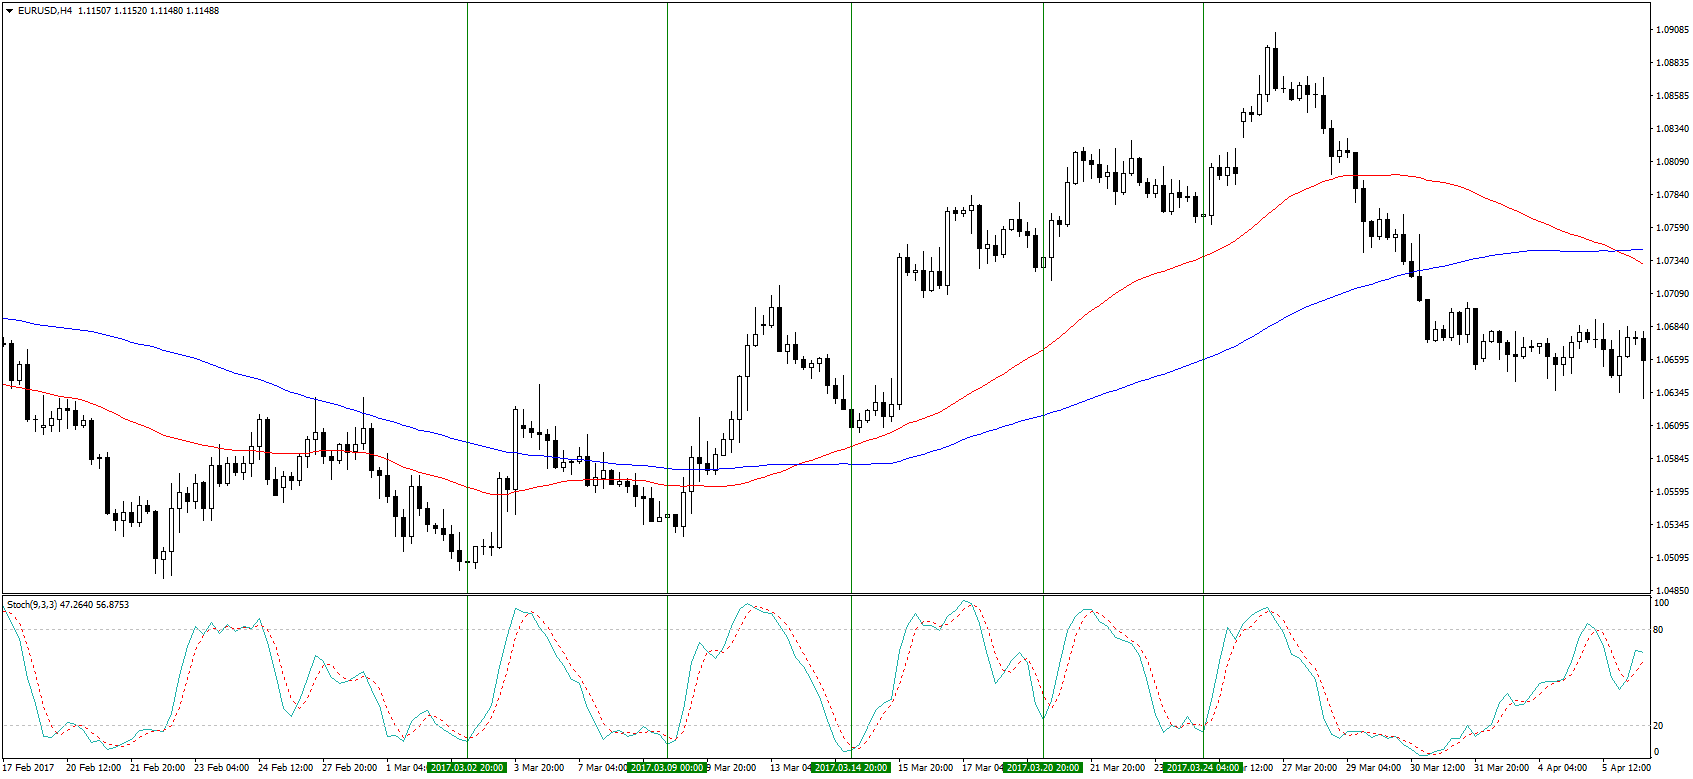
Alternatively, look for candlestick patterns and oscillating indicators that show when the markets are oversold in an uptrend, or overbought in a downtrend.

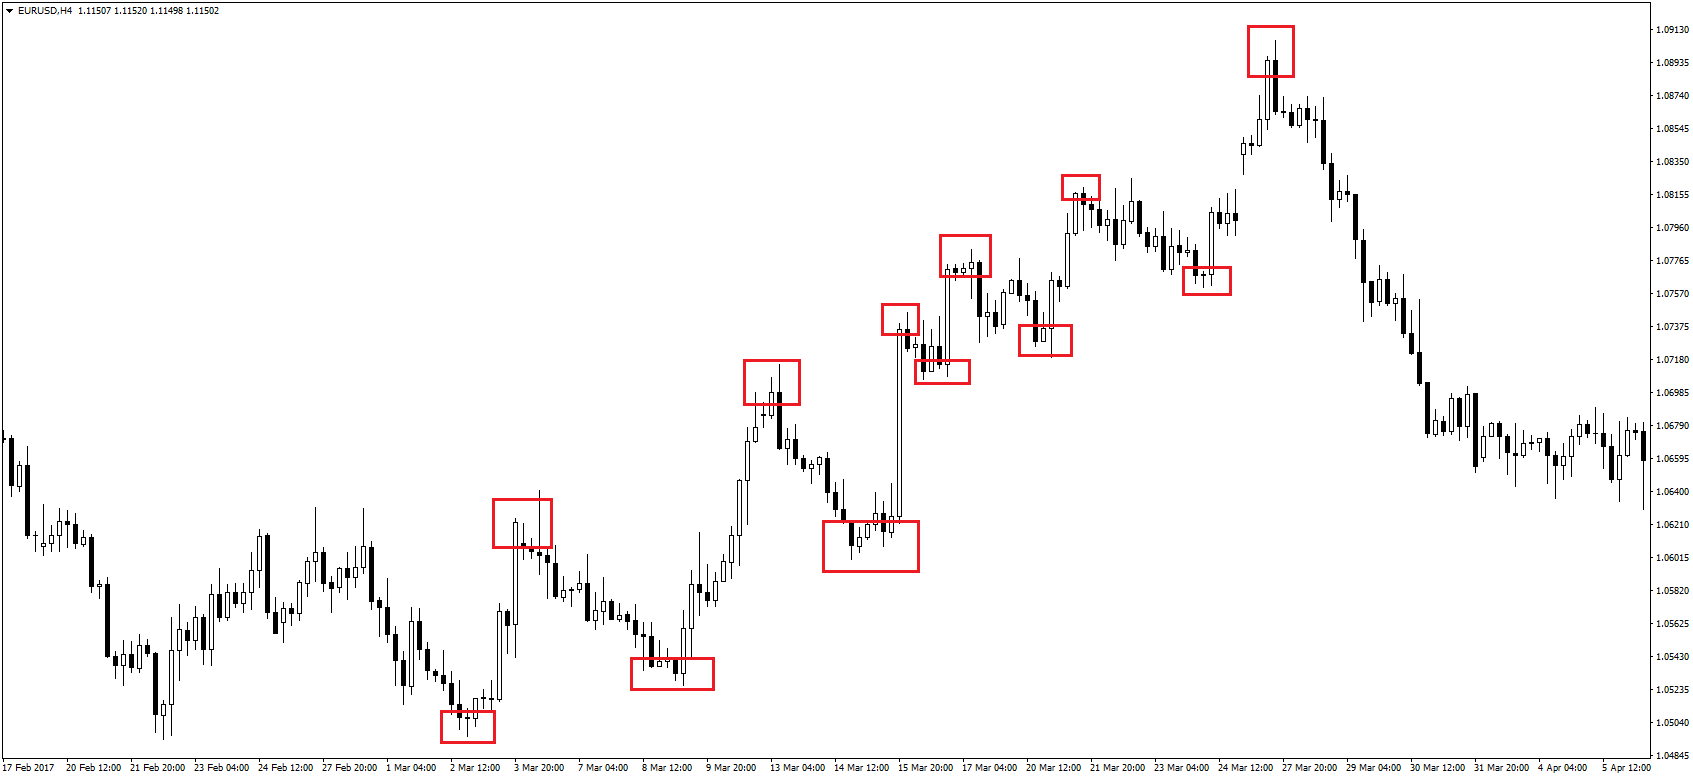
Throughout the uptrend, we can see very distinct candlestick patterns at points A through E:
- A – engulfing candle
- B – hammer
- C – inside bar
- D – inverted hammer
- E – hammer
Alternatively, using the stochastic oscillator indicated that markets were oversold at the corresponding points between A and E, further confirming that the downtrend was just a pullback.
On the other hand, if you don’t have time to wait for the indicators to show oversold conditions, or for candlestick patterns to form, you can still get in on the trend. The first option is through the drawing of S/R levels. The same S/R levels you used to confirm the trend can be used to establish probable points where the pullback might occur.
Now, in our example, we were looking at an already formed trend, for a continuing trend, you will have to establish the S/R levels by moving to a higher timeframe. For example, if you’re working with a 1-hour chart, draw the S/R levels from a 4-hour chart; if you’re working with a daily chart, draw the S/R levels from the weekly chart, and so on. Some Forex trading platforms will have other timeframes like 6-hour, and 12-hour charts; make use of these to draw relevant S/R levels.
Typically, the pullback will occur around the S/R levels, but not at that exact point, so you can use pending orders to place the orders. In an uptrend, I recommend placing a buy limit order slightly above the S/R level. This would be the previous level of resistance broken that you’re hoping will be turned into a level of support. Since you won’t be around to confirm whether the trend is still active, make sure you place a stop loss a few pips below this level. Sometimes the markets will test the S/R levels before resuming the uptrend, so don’t make the stop loss too tight.
The other option could be using Fibonacci retracements. This tool can accurately predict the magnitude of the pullback, and I find it very effective. The Fibonacci retracement should stretch from the previous low to the latest peak. a key retracement level is at 50% retracement, and this is usually a safe bet when using a pullback trading strategy.
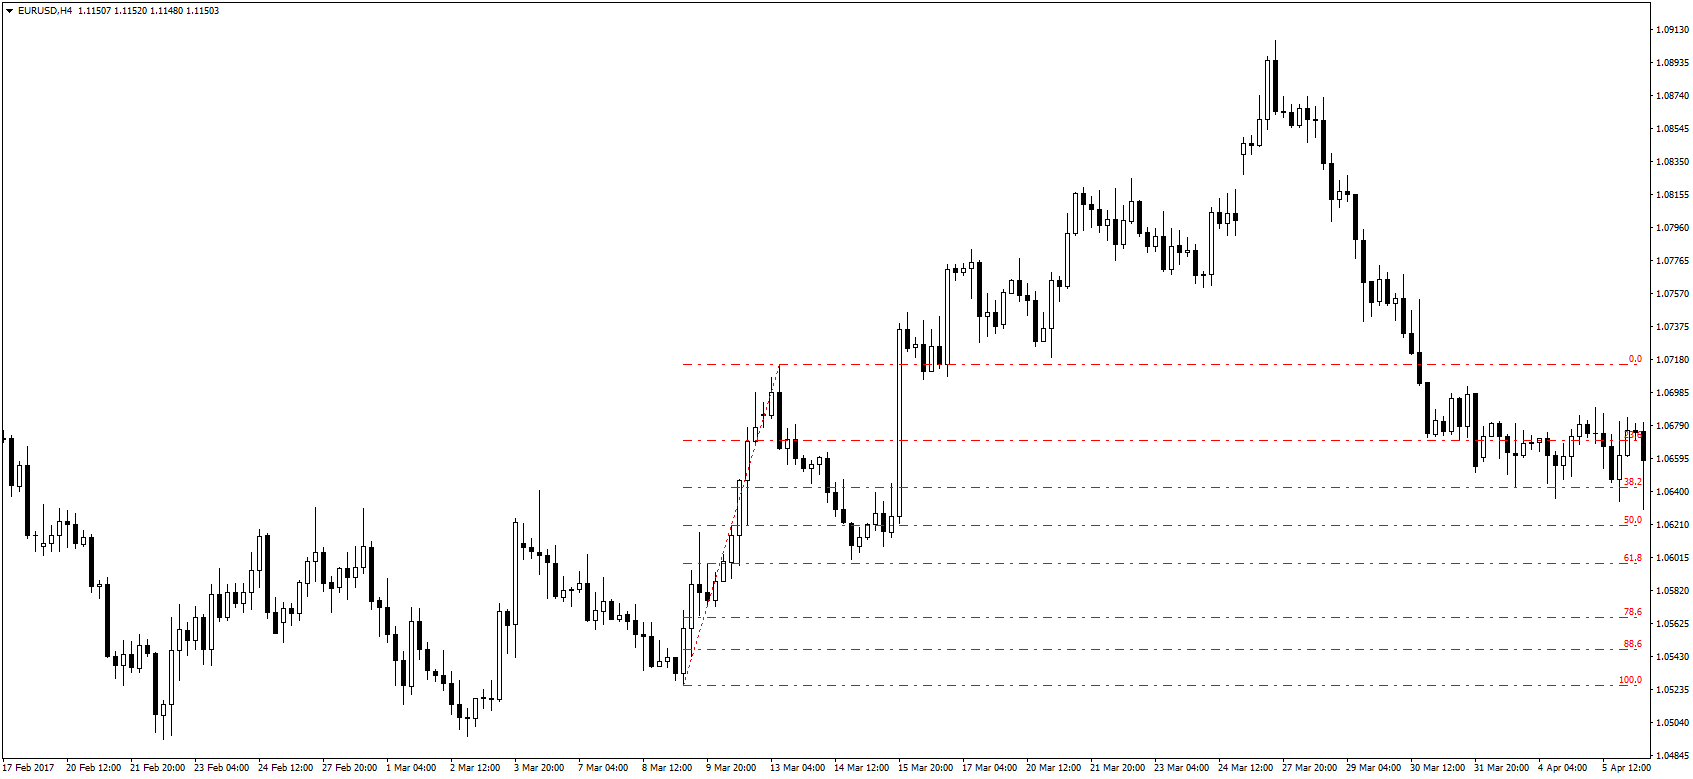
Even though the 50% retracement is a key point, the pullback can occur at any other level, so do not limit yourself to this level. To find a probable pullback point, use other tools like the S/R levels to determine precisely where the markets will turn. (Using the Fibonacci retracement)
You now know how to identify pullbacks in the markets and when to place trades, you’re now free to raid the markets for as many pips as your heart desires. Also, check out some other similar trading strategies like these:
How to earn on corrective waves