Risk Warning: Your capital is at risk. Statistically, only 11-25% of traders gain profit when trading Forex and CFDs. The remaining 74-89% of customers lose their investment. Invest in capital that is willing to expose such risks.

Forex Analysis for USD/ZAR

Filter:
USD/ZAR
Popular
EUR/USD
GBP/USD
USD/CHF
USD/JPY
AUD/USD
Brent
XAU/USD
All instruments:
Forex
USD/CAD
EUR/JPY
EUR/GBP
NZD/USD
EUR/AUD
GBP/JPY
CAD/JPY
EUR/CAD
NZD/JPY
GBP/CHF
CHF/JPY
EUR/NZD
GBP/AUD
CAD/CHF
AUD/NZD
NZD/CAD
GBP/CAD
AUD/CHF
Metals
XAG/USD
XAU/USD
XPD/USD
XPT/USD
XCU/USD
Energy
WTI
Brent
Indexes
S&P500
DOW30
DXY
Select
AUD/CAD
AUD/JPY
AUD/SGD
AUD/USD
BTC/USD
CHF/BGN
CHF/RON
CHF/SGD
CHF/TRY
EUR/CHF
EUR/CZK
EUR/DKK
EUR/HKD
EUR/HUF
EUR/ILS
EUR/MXN
EUR/NOK
EUR/PLN
EUR/RON
EUR/RUB
EUR/SEK
EUR/SGD
EUR/TRY
EUR/USD
EUR/ZAR
GBP/BGN
GBP/CZK
GBP/DKK
GBP/HKD
GBP/HUF
GBP/NOK
GBP/NZD
GBP/PLN
GBP/RON
GBP/SEK
GBP/SGD
GBP/TRY
GBP/USD
GBP/USD
GBP/ZAR
HKD/JPY
NZD/CAD
NZD/CHF
SGD/HKD
SGD/JPY
TRY/JPY
USD/BGN
USD/CHF
USD/CNH
USD/CNY
USD/CZK
USD/DKK
USD/EUR
USD/HKD
USD/HUF
USD/ILS
USD/JPY
USD/MXN
USD/NOK
USD/NOK
USD/PLN
USD/RON
USD/RUB
USD/SEK
USD/SGD
USD/TRY
USD/ZAR
Clear
All Forex brokers
All Forex brokers
Alpari
EXNESS
FBS
FIBO Group
FxPro
FXTM
HYCM
IG
Instaforex
NordFX
RoboForex
Societe Generale is bullish on the rand. And you?
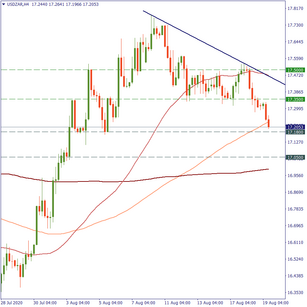
What happened? Societe Generale, a leading European investment bank, expressed optimism over the South African rand’s growth. Why? Firstly, the bank believes the ongoing global recovery will underpin the emerging market currency in the upcoming months. Secondly, the rand is usually influenced by cre...
99
Ichimoku Cloud Analysis 11.03.2021 (EURJPY, USDZAR, AUDUSD)
11.03.2021EURJPY, “Euro vs Japanese Yen”EURJPY is trading at 129.66; the instrument is moving above Ichimoku Cloud, thus indicating an ascending tendency. The markets could indicate that the price may test Tenkan-Sen and Kijun-Sen at 129.25 and then resume moving upwards to reach 130.95. Another sig...
43
TRY, BRL, ZAR, RUB: advantages of exotics
Here are the main exotic currencies offered by FBS in MetaTrader: the Turkish lira, Brazilian real, Mexican Peso, Russian Ruble, South African Rand. Most of them are regional, relatively weak currencies. That’s why, against the USD, they can’t do anything but depreciate – for years. That brings mane...
70
South Africa’s GDP and vaccine hopes drove ZAR up
USD/ZAR dropped to the low levels unseen since February as investors foresee the soon global recovery. What happened? Some countries such as the UK started massive vaccinations, while others are already in the final steps. Therefore, investors streamed their capital to riskier assets like emerging m...
78
USD/ZAR: bears are strong
What happened? The Fed is pushing investors to emerging markets. The lower rates for longer implies the falling yields for the US dollar. Elsewhere, the Covid-19 pandemic is getting out of control in the world’s largest economy, which drives traders away from the US dollar. Moreover, the optimistic ...
52
Danske Bank forecasts USD/ZAR at 15.00
The South African Reserve Bank (SARB) left its interest rate unchanged. That decision underpinned the rand and allowed it to close green yesterday. The enormous government support measures in combination with optimistic vaccine news encouraged investors to stream their capital to emerging markets cu...
49
Ichimoku Cloud Analysis 21.10.2020 (GBPUSD, USDJPY, USDZAR)
21.10.2020GBPUSD, “Great Britain Pound vs US Dollar”GBPUSD is trading at 1.2997; the instrument is moving above Ichimoku Cloud, thus indicating an ascending tendency. The markets could indicate that the price may test the cloud’s upside border at 1.2960 and then resume moving upwards to reach 1.3130...
26
Ichimoku Cloud Analysis 13.10.2020 (GBPUSD, USDZAR, EURUSD)
13.10.2020GBPUSD, “Great Britain Pound vs US Dollar”GBPUSD is trading at 1.3050; the instrument is moving above Ichimoku Cloud, thus indicating an ascending tendency. The markets could indicate that the price may test the cloud’s upside border at 1.3005 and then resume moving upwards to reach 1.3140...
31
Commerzbank’s forecasts on rand
Commerzbank announced its short- and long- term projections on the South African rand. Let’s discuss it in detail. Why may rand rise? Analysts from Commerzbank anticipate the rand will stay at current high levels up to the end of this year and then soar at the beginning of 2021. However, the bank wa...
51
Ichimoku Cloud Analysis 04.09.2020 (EURUSD, USDCAD, USDZAR)
04.09.2020EURUSD, “Euro vs US Dollar”EURUSD is trading at 1.1848 inside the Ichimoku Cloud, suggesting a flat. A test of the upper border of the Cloud near 1.1870 is expected, followed by falling to 1.1685. An additional signal confirming the decline will be a bounce off the resistance level. The de...
31
South African Rand is boosted by risk-on mood
Goldman Sachs claims the ZAR may rise further, if global markets keep rallying. Let’s discuss it in detail. Fundamentals The South African Rand has depreciated a lot during the coronavirus pandemic. Indeed, the emerging economy was struggling from many different problems. The virus spread made thing...
45
Ichimoku Cloud Analysis 07.08.2020 (XAUUSD, USDZAR, GBPUSD)
07.08.2020XAUUSD, “Gold vs US Dollar”XAUUSD is trading at 2063.00; the instrument is moving above Ichimoku Cloud, thus indicating an ascending tendency. The markets could indicate that the price may test the cloud’s upside border at 2050.00 and then resume moving upwards to reach 2115.00. Another si...
30
Ichimoku Cloud Analysis 05.08.2020 (XAUUSD, USDZAR, USDCHF)
05.08.2020XAUUSD, “Gold vs US Dollar”XAUUSD is trading at 2019.00; the instrument is moving above Ichimoku Cloud, thus indicating an ascending tendency. The markets could indicate that the price may test Tenkan-Sen and Kijun-Sen at 2000.00 and then resume moving upwards to reach 2060.00. Another sig...
34
Ichimoku Cloud Analysis 17.07.2020 (GBPJPY, USDZAR, EURNZD)
17.07.2020GBPJPY, “Great Britain Pound vs Japanese Yen”GBPJPY is trading at 134.55; the instrument is moving inside Ichimoku Cloud, thus indicating a sideways tendency. The markets could indicate that the price may test the cloud’s downside border at 134.05 and then resume moving upwards to reach 13...
47
USD/ZAR: stabilization planned
The South African rand has been following a downward trajectory since its peak in early April. The spike at the beginning of June did not change this trend. It aims at the channel within 15.82 – 16.46: this is the likely zone to where the USD/ZAR will drop to pick up its pre-virus trajectory. Given ...
30
Ichimoku Cloud Analysis 08.07.2020 (GBPCHF, BTCUSD, USDZAR)
08.07.2020GBPCHF, “Great Britain Pound vs Swiss Franc”GBPCHF is trading at 1.1831; the instrument is moving above Ichimoku Cloud, thus indicating an ascending tendency. The markets could indicate that the price may test Tenkan-Sen and Kijun-Sen at 1.1790 and then resume moving upwards to reach 1.199...
53
USD: technical outlook
The confusion created by the Sino-American relations coupled with virus-related economic factors pushed the USD to rise against some currencies and lose against the others in today’s session. Let’s see a technical disposition in the most interesting cases so you can set your trades accordingly. USD/...
44
MXN and ZAR: brothers in arms
Technicals On the H4 chart of the USD/MXN, the USD lost its value to drop below the Moving Averages. It trades slightly above the tactical support of 23.07 and appears to be going in consolidation at that level.   The picture with the USD/ZAR is almost identical: the price drops below the Moving Ave...
36
ZAR: the Minister's power
Fundamental On the H1 chart of USD/ZAR, we can see how this currency pair reacted to the speech of the South African Minister of Finance. Tito Mboweni was speaking for one hour, addressing a wide spectrum of issues in the course of the new budget presentation. The speech was controversial at times b...
59
USD/ZAR: a potential top
Trade idea SELL 15.10; TP1 15.05; TP2 15.00; SL 15.12 Yesterday USD/ZAR formed yesterday a bearish engulfing pattern on the D1. The pair also formed a lower high on H1 and H4 and fell below the short-term support line at 15.15 - this level is now acting as resistance. As long as the price stays belo...
21
USD/ZAR: there’s more to come
Trade idea SELL 14.5450; TP 14.4600; SL 14.5730 It looks like USD/ZAR is capable of more downside on the ongoing trade optimism and as the market’s view switches to the Federal Reserve’s meeting later this month. The pair has broken below the 50% Fibonacci retracement of the July-August advance and ...
12
USD/ZAR is still in a range
Trade idea SELL 15.05; TP1 14.95; TP2 14.80; SL 15.08 BUY 15.21; TP1 15.27; TP2 15.40; SL 15.18  Pay attention to the currency pair USD/ZAR. It has been consolidating between 15.10 and 15.50 since the start of August. All in all, the pair is in the area of resistance that limited the advance during ...
13
USD/ZAR turned up
USD/ZAR turned up
Trade idea BUY 14.50; TP 14.65; SL 14.45 USD/ZAR rebounded from the 200-day MA at 14.18, went up through the 100- and 50-day MAs and formed an “inverted Head and Shoulders” pattern. The bullish pattern will remain in place as long as the pair’s above the neckline at 14.35. The cue to buy will come o...
28
The decline in USD/ZAR is on
Trade idea SELL 14.17; TP1 14.1285; TP2 13.98; SL 14.22 USD/ZAR has recently breached down the support line from February lows. It also declined below the 50-, 100- and 200-day MA. The latter is currently providing resistance at 14.2256. The newly established downtrend is well visible on H4. USD/ZAR...
30
USD/ZAR: correction has started
Trade idea SELL 14.60; TP 14.5250; SL 14.63 It looks like USD/ZAR has overdone its increase in the short-term. The currency pair formed a bearish candlestick with a long upper wick on D1. It tested levels beyond the third weekly pivot resistance level but failed to stay there. As a result, we see a ...
10
USD/ZAR is in a triangle
Trade idea SELL 14.34; TP 14.28; SL 14.36 USD/ZAR met the resistance of the line connecting September, March and May highs in the 14.50 area and formed a candlestick with a long upper wick on D1. The pair is consolidating in a triangle and may revisit its lower border provided by the support line si...
7
USD/ZAR can test lower levels
Trade idea SELL 13.92; TP 13.8050; SL 13.95 USD/ZAR met resistance at the line connecting September and October highs and turned down. The pair is currently testing levels below the 200-day MA (13.93) and the 38.2% Fibo retracement of February advance (13.94). The short-term downside target lies at ...
7
The key levels for the South African Rand this week
The South African currency was named as one of the most volatile emerging-market currencies by some analysts and its recent behavior may prove this statement. After the bullish start of the year, the rand has started to weaken since the last Thursday. Let’s point out the main factors affecting the Z...
63
USD/ZAR: a trade idea
Trade idea BUY 14.50; TP1 14.64; TP2 14.85; SL 14.38 There’s a trade idea for USD/ZAR. The pair broke above the resistance line going through October highs but then was stopped by the 50% Fibonacci at 14.6380. This led to a correction down. The previous resistance and now support line plus the 100-...
8
USD/ZAR met resistance
Trade idea SELL at 14.18; TP1 14.00; TP2 13.90; SL 14.26 USD/ZAR recoiled down from the resistance line connecting October highs and slipped under the daily moving averages that now provide resistance at 14.25. The pair closed below the 38.2% Fibonacci level on Wednesday. It is likely to retrace 50...
8


Was the information useful for you?

Categories

Forex Analysis
Forex Technical Analysis
Fundamental Analysis
Forex Market Overview
Daily Forex Forecasts
Weekly Forex Forecasts
Monthly Forex Forecasts
Forex Trade Ideas
Stock Market Analysis
Fractal Analysis
Forex Wave Analysis
Forex Trend Analysis
Ichimoku Analysis
Fibonacci Analysis
Candlestick Analysis
Forex Murrey Math Lines