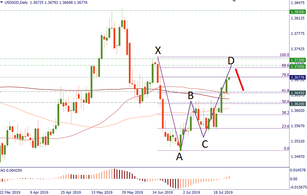
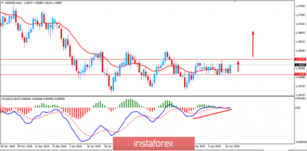
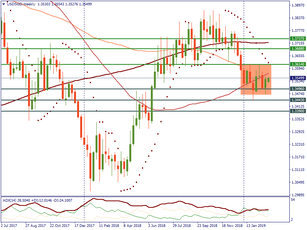
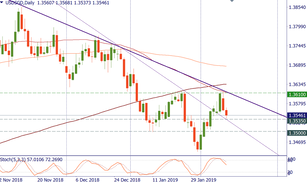
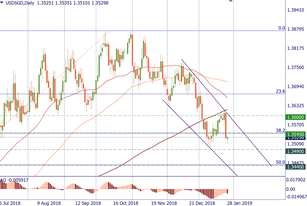
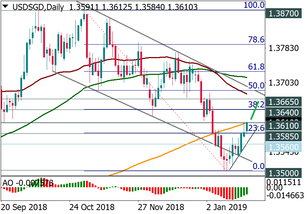
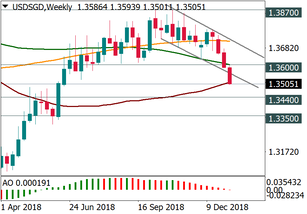
Forex Analysis for USD/SGD
Filter:
USD/SGD
Clear
Popular
EUR/USD
GBP/USD
USD/CHF
USD/JPY
AUD/USD
Brent
XAU/USD
All instruments:
Forex
USD/CAD
EUR/JPY
EUR/GBP
NZD/USD
EUR/AUD
GBP/JPY
CAD/JPY
EUR/CAD
NZD/JPY
GBP/CHF
CHF/JPY
EUR/NZD
GBP/AUD
CAD/CHF
AUD/NZD
NZD/CAD
GBP/CAD
AUD/CHF
Energy
WTI
Brent
Indexes
S&P500
DOW30
DXY
Select
AUD/CAD
AUD/JPY
AUD/SGD
AUD/USD
BTC/USD
CHF/BGN
CHF/RON
CHF/SGD
CHF/TRY
EUR/CHF
EUR/CZK
EUR/DKK
EUR/HKD
EUR/HUF
EUR/ILS
EUR/MXN
EUR/NOK
EUR/PLN
EUR/RON
EUR/RUB
EUR/SEK
EUR/SGD
EUR/TRY
EUR/USD
EUR/ZAR
GBP/BGN
GBP/CZK
GBP/DKK
GBP/HKD
GBP/HUF
GBP/NOK
GBP/NZD
GBP/PLN
GBP/RON
GBP/SEK
GBP/SGD
GBP/TRY
GBP/USD
GBP/USD
GBP/ZAR
HKD/JPY
NZD/CAD
NZD/CHF
SGD/HKD
SGD/JPY
TRY/JPY
USD/BGN
USD/CHF
USD/CNH
USD/CNY
USD/CZK
USD/DKK
USD/EUR
USD/HKD
USD/HUF
USD/ILS
USD/JPY
USD/MXN
USD/NOK
USD/NOK
USD/PLN
USD/RON
USD/RUB
USD/SEK
USD/SGD
USD/TRY
USD/ZAR
All Forex brokers
All Forex brokers
Admiral Markets
Alpari
EXNESS
FBS
FIBO Group
FxPro
HYCM
IG
Instaforex
NordFX
RoboForex
Trade idea SELL 1.3700; TP1 1.3645; TP2 1.3620; SL 1.3720 The chart of USD/SGD offers a look at what seems like a harmonic “Bat” pattern. The pair is currently forming point D. It should be located somewhere around 1.3705 (88.6% Fibo of AB). In addition, there’s a 200-week MA in this area. This mean...
26.07.2019
46
Trade idea SELL 1.3628; TP 1.3598; SL 1.3638 Looking for a way to bet on the weaker USD, we have considered several currency pairs but the one that came to our attention was USD/SGD. The pair has already made a significant decline this week and is now testing the 50-week MA at 1.3650. Still, it doe...
05.06.2019
25
Company does not offer investment advice and the analysis performed does not guarantee results USD/SGD started a bearish trend after the MAS meeting where SGD became 1.6% stronger than USD in October 2018 to 1.9% stronger than USD as at end-March 2019.At the last MAS meeting, the Central bank ack....
18.04.2019
112
Trade idea SELL 1.3539; TP1 1.3528; SL 1.3545 USD/SGD is recoiling down from the resistance line going back from October highs. Stochastic Oscillator is providing a sell signal on the daily chart. The decline below the 50-day MA at 1.3540 will open the way down to 1.3528 (short-term trendline suppor...
29.03.2019
24
The Singapore dollar starts to attract more attention from different analysts. Why does the youngest currency in the world become a subject of interest for them and what are the long-term forecasts? What factors may affect the SGD? Trade truce The Singapore currency is easily affected by the events ...
04.03.2019
71
Trade idea SELL 1.3535; TP 1.35; SL 1.3550 USD/SGD was stopped yesterday by the declining 50-day MA at 1.3610. It’s also where the resistance line from December highs is. The 50-day Moving Average went under the 200-day one, which is a negative sign. Daily Stochastic is falling. If the pair continue...
13.02.2019
26
Trade idea SELL 1.3490; TP 1.3440; SL 1.3505 USD/SGD was rejected last week by the 100-week MA and 200-day MA in the 1.3580 area but managed to close the week above 50-week MA (1.3525). The new week started with the price below this line. On D1, the downtrend continues, MAs are in the bearish positi...
28.01.2019
23
BUY 1.3615; TP1 1.3635; SP2 1.3665; SL 1.3605 USD/SGD has rebounded from the 50-week MA (1.3520) and is now retracing November-January decline. Yesterday the advance stalled at the 200-day MA (1.3610). That was natural: it’s hard for the market to take out such resistance from the first attempt. How...
22.01.2019
27
Trade idea SELL 1.3490; TP1 1.3440; TP2 1.3350; SL 1.3510 USD/SGD formed the top at 1.3870 in October. The pair closed below 50-month MA in December and below 100-week MA (1.3600) last week. On D1, the pair passed down through the 200-day MA (1.3593), which will now play the role of resistance. Yes...
10.01.2019
22