
Verizon: ⬆️ Buy
– Verizon broke daily Triangle
– Likely to rise to resistance level 44.80
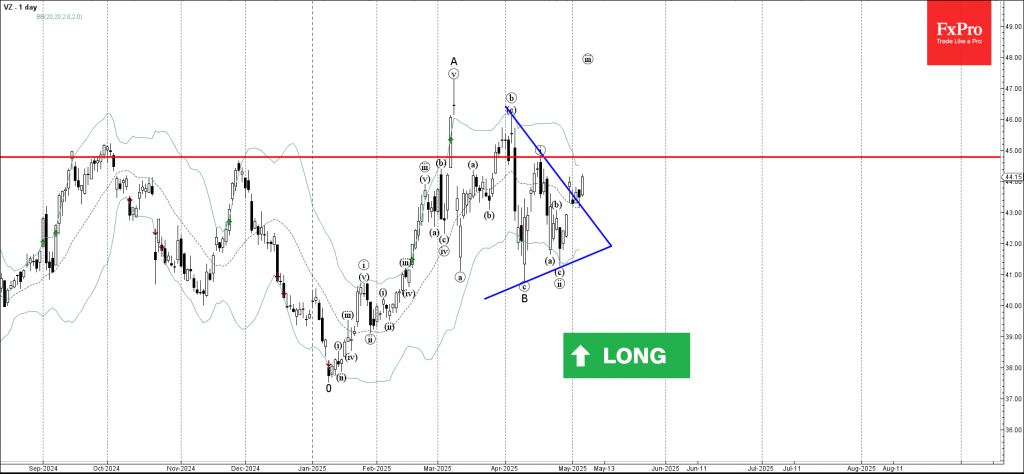
Verizon recently broke the resistance trendline of the daily Triangle from the start of April (which has enclosed the previous waves B, i and ii).
The breakout of this Triangle should accelerate the active impulse wave iii, which belongs to the C-wave from last month.

Verizon can be expected to rise to the next resistance level 44.80 (top of the previous impulse wave (i) from last month).
Source: https://fxpro.news