
Johnson & Johnson: ⬆️ Buy
– Johnson & Johnson rising inside weekly price range
– Likely to test resistance level 165.60
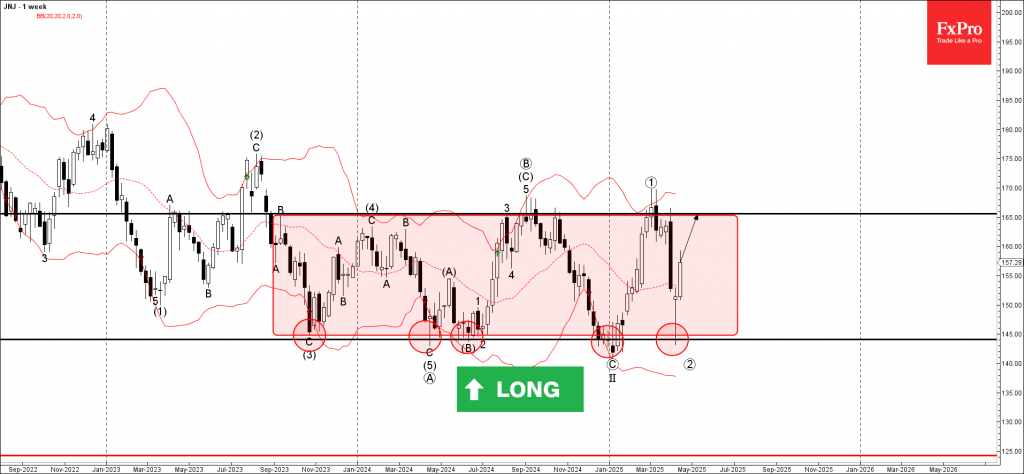
Johnson & Johnson continues to rise in the primary upward impulse wave 3, which started earlier from the major support level 145.00 (lower border of the weekly sideways price range from 2023).
The upward reversal from the support level 145.00 previously formed the weekly Japanese candlesticks reversal pattern Hammer Doaji – which reflected the strength of this price level.

Johnson & Johnson can be expected to rise to the next resistance level 165.60, the upper border of the active sideways price range.
Source: https://fxpro.news