
AIG: ⬆️ Buy
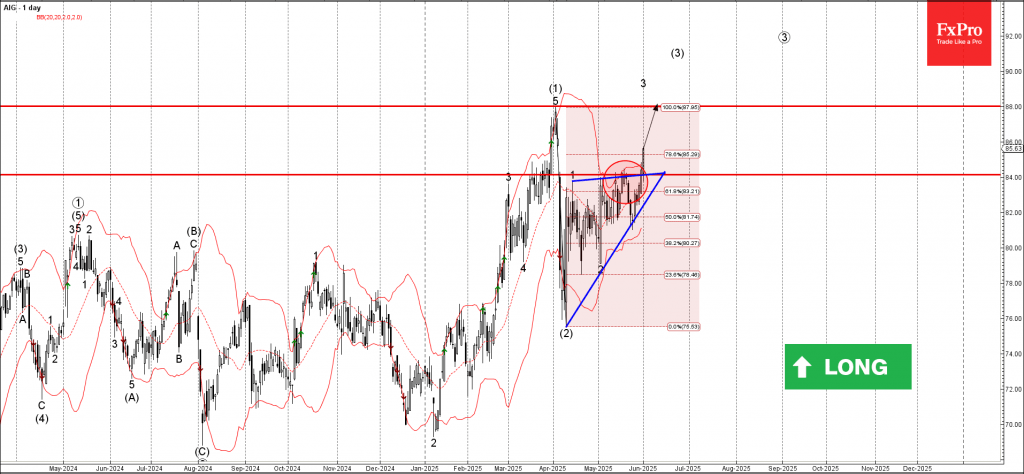
– AIG broke daily Ascending Triangle
– Likely to rise to resistance level 88.00
AIG recently broke the resistance zone between the resistance level 84.00 and the 61.8% Fibonacci correction of the downward wave (2) from March.
The breakout of this resistance zone coincided with the breakout of the daily Ascending Triangle from the start of April.

Given the clear daily uptrend, AIG can be expected to rise to the next resistance level 88.00 (which stopped the earlier sharp impulse wave (1)).
Source: https://fxpro.news